| Investment Objective The investment objective of the scheme is primarily to generate a corpus to provide for pension in the form of periodical income / cash flow to the unit holders to the extent of redemption value of their holding after the age of 58 years by investing in a mix of securities comprising of debt & money market instruments and equity & equity related instruments. However, there is no assurance or guarantee that the investment objective of the Scheme would be achieved. |
|||||||||
| Inception Date |
26th December, 1994 | ||||||||
| Fund Manager |
Mr. V Srivatsa - B.Com., PGDM (IIM-I), CA & ICWA
(Equity Portion) Managing the scheme since Sep 2009 |
||||||||
| Fund AUM |
Fund size monthly average : 4238.20 Crore Closing AUM : 4263.05 Crore |
||||||||
| High/Low NAV in the month |
High Growth Option : 42.4824 Low Growth Option : 41.8756 |
||||||||
Total expense ratio (%) |
Regular : 1.65 Direct : 0.99 |
||||||||
Minimum Investment Amount |
Minimum amount of each investment is 500/- (purchase value). There is no upper limit. | ||||||||
Plans/Options
(Regular / Direct) |
Growth Option | ||||||||
| Portfolio Parameters | Weighted Average Maturity : 10.43 yrs Yield to Maturity* : 7.51% Modified Duration : 5.81 yrs Macaulay Duration : 6.10 yrs *Annualized Portfolio YTM – Yields of all securities are annualized |
||||||||
Market Capitalisation (%) |
|
||||||||
Load Structure |
Entry Load : Nil Exit Load : Nil |
||||||||
NAV per unit as on 31st January, 2024 |
Regular Growth Option 42.4286 Direct Growth Option 45.3647 |
||||||||
Options Available |
SWP Options & SIP | ||||||||
Benchmark Index |
CRISIL Short Term Debt Hybrid 60+40 Index | ||||||||
| SIP/SWP/STRIP | |||||||||
| Fund Size | 4238.20 Crore (Monthly Average as on 31/1/2024) | ||||||||
UTI Retirement Benefit Pension Fund - Bonus Declared |
||||||
Year |
IDCW |
Per unt |
NAV (Cum Div ) |
Face Value (per unit) |
NAV Date |
Record Date |
2007 |
01:10 |
19.3365 |
10.00 |
30-03-2007 |
05-04-2007 |
|
2009 |
01:10 |
21.1539 |
10.00 |
19-05-2009 |
26-05-2009 |
|
2010 |
01:05 |
22.1851 |
10.00 |
31-03-2010 |
07-04-2010 |
|
2011 |
01:10 |
19.8899 |
10.00 |
25-04-2011 |
02-05-2011 |
|
2012 |
01:10 |
18.0822 |
10.00 |
13-06-2012 |
20-06-2012 |
|
2013 |
01:10 |
18.4373 |
10.00 |
23-05-2013 |
30-05-2013 |
|
2014 |
01:10 |
19.9371 |
10.00 |
25-08-2014 |
01-09-2014 |
|
The scheme IDCW details under regular plan.
Disclaimer: Pursuant to payment of Dividend/Bonus, the Nav of the income distribution cum capital withdrawal options of the schemes would fall to the extent of payout and statutory levy (if applicable)
| Financial Services | 33% |
| Automobile & Auto Components | 11% |
| Oil, Gas & Consumable Fuels | 11% |
| Information Technology | 10% |
| Healthcare | 8% |
Portfolio |
% of Nav |
Rating |
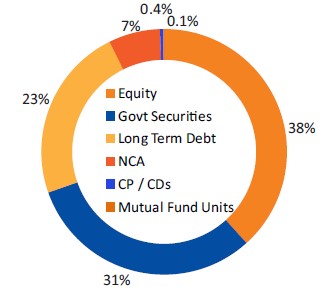
| Equity | ||
| HDFC Bank Ltd. | 3.54 |
|
| ICICI Bank Ltd | 2.99 |
|
| Reliance Industries Ltd. | 2.62 |
|
| Infosys Ltd. | 2.13 |
|
| Larsen And Toubro Ltd. | 1.87 |
|
| ITC Ltd. | 1.56 |
|
| Mahindra & Mahindra Ltd. | 1.21 |
|
| Axis Bank Ltd. | 1.10 |
|
| Bharti Airtel Ltd. | 1.09 |
|
| State Bank Of India | 1.07 |
|
| HCL Technologies Ltd. | 1.06 |
|
| IndusInd Bank Ltd. | 0.96 |
|
| Tata Motors Ltd. | 0.95 |
|
| GAIL (India) Ltd. | 0.88 |
|
| Hero Motocorp Ltd. | 0.71 |
|
| Others | 14.58 |
|
| CP / CDs | ||
| Canara Bank | 0.43 |
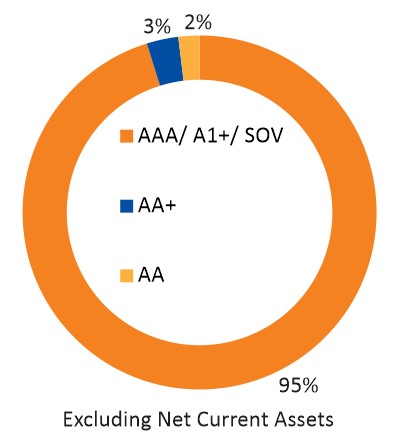
CRISIL AAA/A1+ |
| Govt Securities | ||
| Others | 0.73 |
|
| 07.18% GSEC MAT -24/07/2037 | 12.26 |
SOV |
| 7.26% GSEC MAT - 06/02/2033 | 7.08 |
SOV |
| 7.41% GS MAT - 19/12/2036 | 5.96 |
SOV |
| 07.18% GSEC MAT -14/08/2033 | 3.53 |
SOV |
| 07.30% GSEC MAT -19/06/2053 | 1.77 |
SOV |
| Long Term Debt | ||
| Power Finance Corporation Ltd. | 5.26 |
CRISIL AAA/A1+ |
| HDFC Bank Ltd. | 4.12 |
CRISIL AAA/A1+ |
| REC Ltd | 2.32 |
CRISIL AAA/A1+ |
| Small Industries Development Bank Of India | 1.18 |
CRISIL AAA/A1+ |
| HDFC Bank Ltd. Basel3T2 | 1.17 |
CRISIL AAA/A1+ |
| Jamnagar Utilities And Power Private Ltd.^ | 1.17 |
CRISIL AAA/A1+ |
| LIC Housing Finance Ltd. | 1.17 |
CRISIL AAA/A1+ |
| HDB Financial Services Ltd. | 1.17 |
CRISIL AAA/A1+ |
| Tata Motors Finance Ltd. | 0.70 |
CRISIL AA |
| Indian Railway Finance Corporation Ltd. | 0.59 |
CRISIL AAA/A1+ |
| Others | 4.20 |
|
| Mutual Fund Units | ||
| UTI MF - Nifty 50 Exchange Traded Fund | 0.11 |
|
| Net Current assets | 6.79 |
|
| Total | 100.00 |
^ Mukesh Ambani promoter Group company
Median Market Cap ( Cr) |
279,091 |
Weighted Average Market Cap |
464,297 |
Number of Securities |
60 |
All figures given are provisional and unaudited. |
Quantitative Indicators |
Fund |
Benchmark |
Beta |
0.96 |
1 |
Standard Deviation (Annual) |
5.87% |
5.89% |
Sharpe ratio |
1.15% |
|
| Portfolio Turnover Ratio (Annual) | 0.30 |
| Fund Performance Vs Benchmark (CAGR) as on 31st January, 2024 Growth of 10000 |
||||||
| Period | NAV Growth (%) |
CRISIL Short Term Debt Hybrid 60+40 Index (%) |
Nifty 50 (%) |
NAV Growth () |
CRISIL Short Term Debt Hybrid 60+40 Index () |
Nifty 50 () |
| 1 Y | 18.15 |
16.41 |
24.35 |
11,815 |
11,641 |
12,435 |
| 3 Y | 13.59 |
11.46 |
18.19 |
14,656 |
13,847 |
16,510 |
| 5 Y | 10.61 |
11.79 |
16.29 |
16,561 |
17,464 |
21,276 |
| SI* | 10.62 |
NA |
NA |
188,947 |
NA |
NA |
Different plans have a different expense structure. The performance details provided herein are of regular plan.
*Compounded annualized Growth Rate.
The current fund manager is managing the scheme since Dec 2006
For performance details of other Schemes managed by the Fund Manager, please refer the respective Scheme sheets as listed in Please click here in ‘Fund Manager Summary’. N.A - Not Available. Schemes Managed by Mr. Sunil Madhukar Patil & Mr V. Srivatsa. Load is not taken into consideration for computation of performance.
| Period | |||||||
|
Investment Amount ()
|
Value- Fund ()
|
CRISIL Short Term Debt Hybrid 60+40 Index ()
|
Nifty 50
() |
Yield (%) Fund
|
Yield (%) CRISIL Short Term Debt Hybrid 60+40 Index
|
Yield (%)
Nifty 50 |
|
1 Y |
120,000 |
132,924 |
132,146 |
138,471 |
20.49 |
19.22 |
29.62 |
3 Y |
360,000 |
438,075 |
427,302 |
459,553 |
13.16 |
11.44 |
16.50 |
5 Y |
600,000 |
836,722 |
814,119 |
947,510 |
13.26 |
12.15 |
18.32 |
7 Y |
840,000 |
1,239,601 |
1,259,922 |
1,496,823 |
10.92 |
11.38 |
16.20 |
10 Y |
1,200,000 |
2,023,337 |
2,122,851 |
2,594,881 |
10.08 |
10.98 |
14.74 |
15 Y |
1,800,000 |
3,970,626 |
4,307,195 |
5,566,777 |
9.86 |
10.82 |
13.82 |
SI |
2,300,000 |
6,362,358 |
7,103,393 |
9,702,353 |
9.68 |
10.66 |
13.37 |
Note: Systematic Investment Plan (SIP) returns are worked out assuming investment of 10,000/- every month at NAV per unit of the scheme as on the first working day for the respective time periods. The loads have not been taken into account. Past performance may or may not be sustained in future.
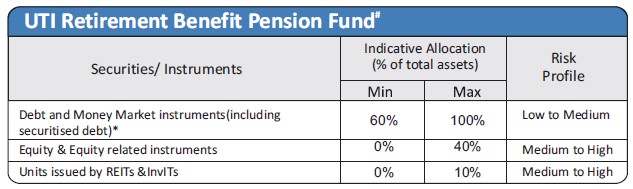
# The fund may invest up to 50% of its debt portfolio in securitized debt.
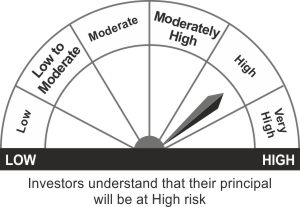
*Investors should consult their Mutual Fund Distributor if in doubt about whether the product is suitable for them.:
- Long Term Capital Appreciation
- Investment in equity instruments (maximum-40%) and debt/ Money market Instruments
*Investors should consult their financial advisers if in doubt about whether the product is suitable for them.