| Investment Objective The Investment objective of the Scheme is to provide returns that, before expenses, corresponds to the total return of the securities as represented by the underlying index, subject to tracking error. However, there is no guarantee or assurance that the investment objective of the scheme will be achieved. |
|||||||||
| Inception Date |
10th May, 2023 | ||||||||
| Fund Manager |
Mr. Sharwan Kumar Goyal, B.Com, MMS, CFA Managing the scheme since May 10, 2023. Mr. Ayush Jain, Asst. Fund Manager, B.com (Tax), C.A |
||||||||
| Fund AUM |
Fund Size Monthly Average : 188.02 Crore Closing AUM : 175.83 Crore |
||||||||
| High/Low NAV in the month |
High Growth Option : 16.5289 Crore Low Growth Option : 15.3363 Crore |
||||||||
Total expense ratio (%) |
Regular : 1.00 Direct : 0.53 |
||||||||
Minimum Investment Amount |
5000/- subsequent minimum investment under a folio is 1000/- and in multiples of 1/- thereafter with no upper limit | ||||||||
Plans/Options
(Regular / Direct) |
Growth Option | ||||||||
| Market Capitalisation (%) |
|
||||||||
Load Structure |
Entry Load : NA Exit Load : Nil *In terms of SEBI circular no. SEBI/IMD/CIR No.4/168230/09 dated June 30, 2009, no entry load will be charged by the Scheme to the investor effective August 1, 2009 |
||||||||
NAV per unit as on 31st January, 2024 |
Regular Growth Option : 16.5289 Direct Growth Option : 16.5924 |
||||||||
Benchmark Index |
Nifty 500 Value 50 TRI | ||||||||
| Oil, Gas & Consumable Fuels | 26% |
| Financial Services | 25% |
| Metals & Mining | 20% |
| Power | 13% |
| Chemicals | 6% |
|
Equity
|
% of NAV
|
| Oil & Natural Gas Corporation Ltd. | 5.53 |
| Power Grid Corporation Of India Ltd | 5.05 |
| Coal India Ltd. | 5.04 |
| Vedanta Ltd | 4.97 |
| Grasim Industries Ltd. | 4.78 |
| NTPC Ltd. | 4.66 |
| Tata Steel Ltd. | 4.57 |
| State Bank Of India | 4.56 |
| Hindalco Industries Ltd. | 4.54 |
| Indian Oil Corporation Ltd. | 4.39 |
| Power Finance Corporation Ltd. | 3.39 |
| Bharat Petroleum Corporation Ltd. | 3.07 |
| UPL Ltd. | 2.70 |
| GAIL (India) Ltd. | 2.63 |
| REC Ltd | 2.50 |
| Steel Authority Of India Ltd. | 2.32 |
| Bank Of Baroda | 2.30 |
| NHPC Ltd. | 2.21 |
| NMDC Ltd. | 1.92 |
| Hindustan Petroleum Corporation Ltd. | 1.90 |
| Oil India Ltd. | 1.71 |
| Canara Bank | 1.69 |
| Redington Ltd | 1.57 |
| National Aluminium Company Ltd. | 1.46 |
| Petronet LNG Ltd. | 1.36 |
| Punjab National Bank | 1.29 |
| Great Eastern Shipping Co. Ltd. | 1.19 |
| Federal Bank Ltd. | 1.11 |
| Union Bank Of India | 1.07 |
| CESC Ltd | 1.04 |
| Others | 13.50 |
| Net Current Assets | -0.01 |
| TOTAL | 100.00 |
% of top 10 stocks |
48.10 |
Median Market Cap ( Cr) |
130,125 |
Weighted Average Market Cap |
153,723 |
Number of Securities |
50 |
All figures given are provisional and unaudited. |
| Fund Performance Vs Benchmark (CAGR) as on 31st January, 2024 Growth of 10000 |
||||||
| Period | NAV Growth (%) |
NIFTY 500 Value 50 TRI (%) |
Nifty 50 TRI (%) |
NAV Growth () |
NIFTY 500 Value 50 TRI () |
Nifty 50 TRI () |
| 6 Months | 88.24 |
94.17 |
21.01 |
14,400 |
14,695 |
11,048 |
| SI* | 92.48 |
76.01 |
27.34 |
16,689 |
15,498 |
11,977 |
Different plans have a different expense structure. The performance details provided herein are of regular plan.
Returns less than 1 year are Simple Annualized Growth Rate
For performance details of other Schemes managed by the Fund Manager, please refer the respective Scheme sheets as listed Please click here in ‘Fund Manager No of Schemes Managed by Mr. Sharwan Kumar Goyal & Mr Ayush Jain.
The performance of the benchmark is calculated using total return index variant of the benchmark index. Load is not taken into consideration for computation of performance.
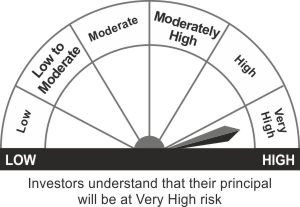
*Investors should consult their Mutual Fund Distributor if in doubt about whether the product is suitable for them.
- Returns that are commensurate with the performance of the Nifty 500 Value 50 Index over long term, subject to tracking error.
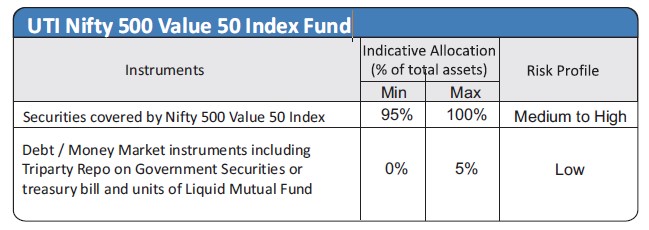
- Investment in securities covered by the Nifty 500 Value 50 Index.
*Investors should consult their financial advisers if in doubt about whether the product is suitable for them.