| Investment Objective Investment objective of the scheme is primarily to provide return through growth in the NAV or through dividend distribution (IDCW) and reinvestment thereof. Amounts collected under the scheme shall generally be invested as follows: (a) Not less than 60% of the funds in debt instruments with low to medium risk profile. (b) Not more than 40% of the funds in equities and equity related instruments. |
|||||||||
| Date of inception/allotment |
1st October, 1971 | ||||||||
| Fund Manager |
Mr. Sunil Madhukar Patil , M.com.,MFM (Debt portion) Managing the scheme since Dec 2021 Mr. Ajay Tyagi - Master in Finance, CFA Charterholder (Equity Porfolio) Managing the scheme since Dec 2014 |
||||||||
| Fund AUM |
Fund size monthly average : 5326.26 Crore Closing AUM : 5292.71 Crore |
||||||||
| High/Low NAV in the month |
High Growth Option : 36.3271 Low Growth Option : 35.6819 |
||||||||
| Total expense ratio% | Existing : 1.62 Direct : 0.91 |
||||||||
| Minimum Investment Amount | Target amount enhanced to 15,00,000/- Minimum Target amount 15,000/- |
||||||||
Plans/Options
(Regular / Direct) |
10 year Plan / 15 year Plan | ||||||||
| Portfolio Parameters |
First Business Receivable Trust : 0.17 yrs *Annualized Portfolio YTM – Yields of all securities are annualized |
||||||||
| Market Capitalisation (%) |
|
||||||||
Load Structure |
Entry Load : Nil Exit Load : 2% for premature withdrawal Nil - On or after maturity |
||||||||
NAV per unit as on 31st January, 2024 |
Existing Growth Option 35.8843 |
||||||||
Options Available |
SIP | ||||||||
Benchmark Index |
NIFTY 50 Hybrid Composite Debt 50:50 Index | ||||||||
| SIP/SWP/STRIP | |||||||||
| Fund Size | 5326.26 Crore (Monthly Average as on 31/1/2024) | ||||||||
UTI Unit Linked Insurance Plan - Bonus declared |
||||||
Year |
IDCW |
Per unt |
NAV (Cum Div ) |
Face Value (per unit) |
NAV Date |
Record Date |
2006 |
02:15 |
17.1209 |
10.00 |
30-03-2006 |
06-04-2006 |
|
2007 |
1.10 |
15.4634 |
10.00 |
30-03-2007 |
06-04-2007 |
|
2008 |
1.10 |
15.3404 |
10.00 |
30-09-2008 |
07-10-2008 |
|
2010 |
1.10 |
18.2637 |
10.00 |
23-02-2010 |
02-03-2010 |
|
2011 |
1.10 |
18.8819 |
10.00 |
25-04-2011 |
02-05-2011 |
|
2012 |
1.10 |
17.6937 |
10.00 |
13-06-2012 |
20-06-2012 |
|
2013 |
1.10 |
18.1324 |
10.00 |
23-05-2013 |
30-05-2013 |
|
2014 |
1.10 |
19.2033 |
10.00 |
25-08-2014 |
01-09-2014 |
|
The scheme IDCW details under regular plan.
Disclaimer: Pursuant to payment of Dividend/Bonus, the Nav of the income distribution cum capital withdrawal options of the schemes would fall to the extent of payout and statutory levy (if applicable)
| Financial Services | 24% |
| Information Technology | 15% |
| Consumer Services | 13% |
| Healthcare | 12% |
| Consumer Durables | 11% |
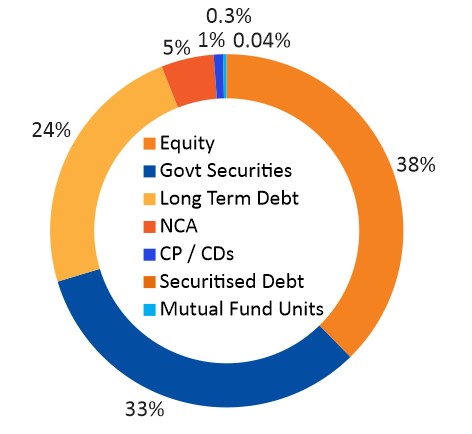
| Portfolio | % of Nav |
Rating |
| Equity | ||
| LTIMindtree Ltd. | 2.48 |
|
| ICICI Bank Ltd | 2.41 |
|
| HDFC Bank Ltd. | 2.23 |
|
| Bajaj Finance Ltd. | 2.06 |
|
| Infosys Ltd. | 1.61 |
|
| Kotak Mahindra Bank Ltd. | 1.47 |
|
| Avenue Supermarts Ltd. | 1.44 |
|
| Info-Edge (India) Ltd. | 1.30 |
|
| Coforge Ltd | 1.28 |
|
| Titan Company Ltd. | 1.27 |
|
| Astral Ltd. | 1.02 |
|
| Maruti Suzuki India Ltd. | 0.77 |
|
| Asian Paints Ltd. | 0.66 |
|
| Ajanta Pharma Ltd. | 0.62 |
|
| Shree Cement Ltd. | 0.62 |
|
| Others | 16.40 |
|
| CP / CDs | ||
| HDFC Bank Ltd. | 0.35 |
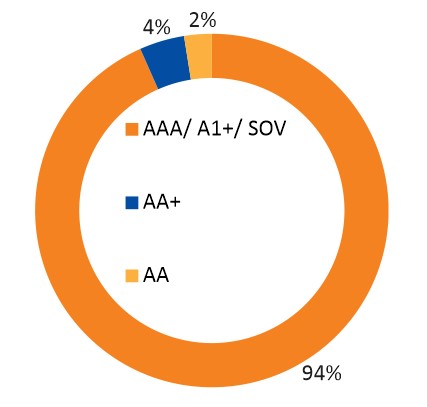
CARE AAA/A1+ |
| Kotak Mahindra Bank Ltd. | 0.34 |
CRISIL AAA/A1+ |
| Reliance Industries Ltd. | 0.07 |
CRISIL AAA/A1+ |
| National Bank For Agriculture And Rural Development | 0.07 |
CRISIL AAA/A1+ |
| HDFC Securities Ltd | 0.03 |
CRISIL AAA/A1+ |
| Govt Securities | ||
| Others | 3.29 |
|
| 07.18% GSEC MAT -24/07/2037 | 10.82 |
SOV |
| 7.41% GS MAT - 19/12/2036 | 7.20 |
SOV |
| 7.26% GSEC MAT - 06/02/2033 | 5.70 |
SOV |
| 07.30% GSEC MAT -19/06/2053 | 2.84 |
SOV |
| 07.18% GSEC MAT -14/08/2033 | 2.84 |
SOV |
| Long Term Debt | ||
| Power Finance Corporation Ltd. | 4.46 |
CRISIL AAA/A1+ |
| HDFC Bank Ltd. | 3.22 |
CRISIL AAA/A1+ |
| REC Ltd | 2.86 |
CRISIL AAA/A1+ |
| Indian Railway Finance Corporation Ltd. | 1.89 |
CRISIL AAA/A1+ |
| Jamnagar Utilities And Power Private Ltd. ^ | 1.41 |
CRISIL AAA/A1+ |
| State Bank Of India Basel3At1 | 1.40 |
CRISIL AA+ |
| Small Industries Development Bank Of India | 1.02 |
CRISIL AAA/A1+ |
| HDFC Bank Ltd. Basel3T2 | 0.94 |
CRISIL AAA/A1+ |
| LIC Housing Finance Ltd. | 0.94 |
CRISIL AAA/A1+ |
| HDB Financial Services Ltd. | 0.94 |
CRISIL AAA/A1+ |
| Others | 4.55 |
|
| Mutual Fund Units | ||
| UTI Nifty Bank Exchange Traded Fund ETF | 0.04 |
|
| Securitised Debt | ||
| First Business Receivable Trust$ | 0.30 |
IND AAA/A1+ |
| Net Current assets | 4.82 |
|
| Total | 100.00 |
$ Underlying customer - Reliance Group Company
^ Mukesh Ambani promoter Group company
Median Market Cap ( Cr) |
109,988 |
Weighted Average Market Cap |
262,716
|
Number of Securities |
57 |
All figures given are provisional and unaudited. |
Quantitative Indicators |
Fund |
Benchmark |
Beta |
0.69 |
1 |
Standard Deviation (Annual) |
5.64% |
7.37% |
Sharpe ratio |
0.17% |
|
| Portfolio Turnover Ratio (Annual) | 0.04 |
As on 31st January, 2024
| Fund Performance Vs Benchmark (CAGR) as on 31st January, 2024 Growth of 10000 |
||||||
| Period | NAV Growth (%) |
NIFTY 50 Hybrid Composite Debt 50:50 Index(%) |
Nifty 50 (%) |
NAV Growth () |
NIFTY 50 Hybrid Composite Debt 50:50 Index () |
Nifty 50 () |
| 1 Y | 12.03 |
15.95 |
24.35 |
11,203 |
11,595 |
12,435 |
| 3 Y | 7.82 |
11.65 |
18.19 |
12,534 |
13,918 |
16,510 |
| 5 Y | 7.43 |
12.43 |
16.29 |
14,312 |
17,970 |
21,276 |
| SI* | 10.39 |
NA |
NA |
1,771,030 |
NA |
NA |
Different plans have a different expense structure. The performance details provided herein are of regular plan.
*Compounded annualized Growth Rate.
The current fund manager is managing the scheme since Dec 2006 & Co- Fund Manager managing Scheme since Dec 2014.
For performance details of other Schemes managed by the Fund Manager, please refer the respective Scheme sheets as listed in Please click here in ‘Fund Manager Summary’. N.A - Not
Available. Schemes Managed by Mr. Sunil Madhukar Patil & Mr. Ajay Tyagi. Load is not taken into consideration for computation of performance.
| Period | |||||||
|
Investment Amount ()
|
Value- Fund
() |
NIFTY 50 Hybrid
Composite Debt 50:50 Index () |
Nifty 50 TRI
() |
Yield (%) Fund
|
Yield (%) NIFTY 50 Hybrid
Composite Debt 50:50 Index |
Yield (%)
Nifty 50 TRI |
|
1 Year |
120,000 |
127,376 |
131,564 |
138,471 |
11.55 |
18.28 |
29.62 |
3 Years |
360,000 |
399,859 |
426,693 |
459,553 |
6.93 |
11.34 |
16.50 |
5 Years |
600,000 |
743,202 |
821,783 |
947,510 |
8.49 |
12.53 |
18.32 |
7 Years |
840,000 |
1,100,125 |
1,283,711 |
1,496,823 |
7.58 |
11.90 |
16.20 |
10 Years |
1,200,000 |
1,785,248 |
2,172,306 |
2,594,881 |
7.71 |
11.42 |
14.74 |
15 Years |
1,800,000 |
3,519,695 |
4,415,367 |
5,566,777 |
8.42 |
11.11 |
13.82 |
Since inception |
2,300,000 |
5,869,733 |
7,396,326 |
9,702,353 |
8.96 |
11.01 |
13.37 |
Note: Systematic Investment Plan (SIP) returns are worked out assuming investment of 10,000/- every month at NAV per unit of the scheme as on the first working day for the respective time periods. The loads have not been taken into account. Past performance may or may not be sustained in future.
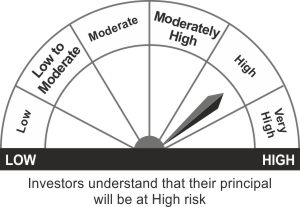
*Investors should consult their Mutual Fund Distributor if in doubt about whether the product is suitable for them.:
- Long Term Capital Appreciation
- Investment in equity instruments (maximum-40%) and debt Instruments
*Investors should consult their financial advisers if in doubt about whether the product is suitable for them.
*Temporary disconnuaon of fresh subscripon (w.e.f August 01, 2022)