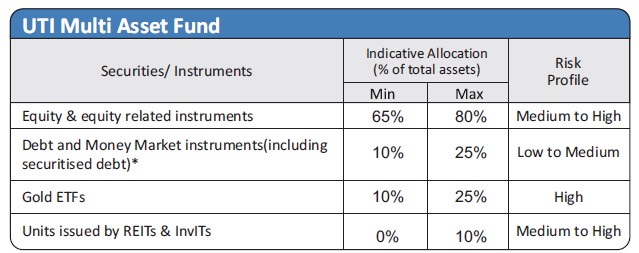
| Investment Objective The objective of the Scheme is to achieve long term capital appreciation by investing predominantly in a diversified portfolio of equity and equity related instruments. The fund also invests in debt and money market instruments with a view to generate regular income. The fund also invests in Gold ETFs. The portfolio allocation is managed dynamically. However, there is no assurance or guarantee that the investment objective of the Scheme would be achieved. |
|||||||||||||
Inception Date |
19th November, 2008 | ||||||||||||
Fund Manager |
Mr. Sharwan Kumar Goyal, CFA, MMS (Equity/Gold Portion) MAnaging the scheme since Nov 2021 & Mr. Sunil Madhukar Patil , M.com.,MFM (Debt Portion) Managing the scheme since Sep 2021 |
||||||||||||
Fund AUM |
Fund size monthly average : 1108.34 Crore Closing AUM : 1152.39 Crore |
||||||||||||
High/Low NAV in the month |
High Growth Option :60.8931 Low Growth Option : 59.2642 |
||||||||||||
Total expense ratio (%) |
Regular : 1.88 Direct : 1.10 |
||||||||||||
Minimum Investment Amount |
Growth, IDCW: 5,000/- | ||||||||||||
Plans/Options
(Regular / Direct) |
Growth option IDCW option with Payout and Reinvestment | ||||||||||||
| Market Capitalisation (%) |
|
||||||||||||
| Portfolio Parameters | Weighted Average Maturity : 4.37 Yrs Yield to Maturity* : 6.96% Modified Duration :2.87 Yrs Macaulay Duration: 2.97 Yrs *Annualized Portfolio YTM – Yields of all securities are annualized |
||||||||||||
| WBINDX4 Returns | Monthly Returns : 6.69% Quarterly Returns : 0.25% HalfYearly Returns: 1.27% Annual Returns-Absolute: 2.12% 2 Year CAGR: 18.64% 3 Year CAGR: 10.10% 5 Year CAGR: 6.68% 10 Year CAGR: 12.66% YTD: 0.92% |
||||||||||||
Load Structure |
Entry Load : Nil Exit Load (A) Redemption / Switch out within 12 months from the date of allotment – (i) upto 10% of the allotted Units – NIL (ii) beyond 10% of the allotted Units - 1.00 % (B) Redemption / Switch out after 12 months from the date of allotment – NIL |
||||||||||||
NAV per unit as on 31st January, 2024 |
Regular Growth Option 60.8931 Regular IDCW Option 24.8842 Direct Growth Option 66.4435 Direct IDCW Option 28.1577 |
||||||||||||
Benchmark Index |
S&P BSE 200 TRI (65%), CRISIL Composite Bond Index (25%) Price of Gold (10%) | ||||||||||||
| Fund Size | 1108.34 Crore (Monthly Average as on 31/1/2024) | ||||||||||||
SIP/SWP/STRIP |
|||||||||||||
Overweight (Top 5) |
% |
Underweight (Top 5) |
% |
| NTPC Ltd. | 2.19 |
HDFC Bank Ltd. | -8.16 |
| Tata Motors Ltd. | 1.84 |
Reliance Industries Ltd. | -7.23 |
| Coal India Ltd. | 1.50 |
ICICI Bank Ltd | -5.29 |
| Oil & Natural Gas Corporation Ltd. | 1.48 |
Infosys Ltd. | -4.36 |
| Bajaj Auto Ltd. | 1.44 |
Tata Consultancy Services Ltd. | -2.87 |
UTI Multi Asset Allocation Fund ( Erstwhile UTI Multi Asset Fund ) - IDCW Declared |
||||||
Year |
IDCW |
Rs. Per unt |
NAV (Cum Div ) |
Face Value (per unit) |
NAV Date |
Record Date |
2020 |
0.85% |
0.85 |
17.6850 |
10.00 |
15-01-2020 |
22-01-2020 |
2020 |
0.85% |
0.85 |
17.6864 |
10.00 |
17-02-2020 |
24-02-2020 |
2020 |
0.85% |
0.85 |
15.3095 |
10.00 |
16-03-2020 |
23-02-2020 |
2020 |
0.85% |
0.085 |
15.9355 |
10.00 |
15-06-2020 |
22-06-2020 |
2020 |
0.85% |
0.085 |
16.8188 |
10.00 |
15-07-2020 |
22-07-2020 |
2020 |
0.80% |
0.0850 |
17.7898 |
10.00 |
18-08-2020 |
25-08-2020 |
2020 |
0.85% |
0.0850 |
17.7579 |
10.00 |
16-09-2020 |
23-09-2020 |
2020 |
0.85% |
0.0850 |
17.7479 |
10.00 |
19-10-2020 |
26-10-2020 |
2020 |
0.85% |
0.0850 |
18.3413 |
10.00 |
18-11-2020 |
25-11-2020 |
2020 |
0.85% |
0.0850 |
18.6632 |
10.00 |
16-12-2020 |
23-12-2020 |
2021 |
0.85% |
0.0850 |
18.9348 |
10.00 |
18/01/2021 |
25/01/2021 |
2021 |
0.85% |
0.0850 |
19.2624 |
10.00 |
17/02/2021 |
24/02/2021 |
2021 |
0.85% |
0.0850 |
19.0502 |
10.00 |
15/03/2021 |
22/03/2021 |
2021 |
0.85% |
0.0850 |
18.7674 |
10.00 |
19/04/2021 |
26/04/2021 |
2021 |
0.85% |
0.0850 |
19.5092 |
10.00 |
16/06/2021 |
23/06/2021 |
2021 |
0.85% |
0.0850 |
19.6211 |
10.00 |
15-07-2021 |
22-07-2021 |
2021 |
0.85% |
0.0850 |
19.8140 |
10.00 |
16-08-2021 |
23-08-2021 |
2021 |
0.85% |
0.0850 |
20.3691 |
10.00 |
15-09-2021 |
22-09-2021 |
2022 |
2.55% |
0.2550 |
20.5080 |
10.00 |
17-01-2022 |
24-01-2022 |
2022 |
2.55% |
0.2550 |
19.5998 |
10.00 |
19-04-2022 |
26-04-2022 |
2022 |
2.55% |
0.2550 |
19.4689 |
10.00 |
13-10-2022 |
20-10-2022 |
2023 |
2.55% |
0.2550 |
19.8305 |
10.00 |
16-01-2023 |
20-01-2023 |
2023 |
2.55% |
0.2550 |
20.0121 |
10.00 |
17-04-2023 |
21-04-2023 |
2023 |
2.55% |
0.2550 |
22.1891 |
10.00 |
16-10-2023 |
20-10-2023 |
The scheme IDCW details under regular plan.
Disclaimer: Pursuant to payment of Dividend/Bonus, the Nav of the income distribution cum capital withdrawal options of the schemes would fall to the extent of payout and statutory levy (if applicable)
| Automobile and Auto Components | 19% |
| Financial Services | 15% |
| Capital Goods | 12% |
| Oil, Gas & Consumable Fuels | 12% |
| Fast Moving Consumer Goods | 8% |
| Portfolio | % of Nav |
Rating |
Futures |
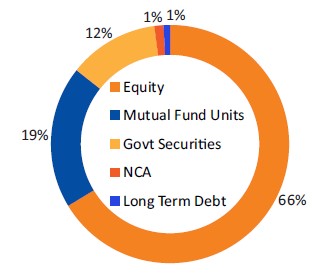
| Equity | |||
| ICICI Bank Ltd | 5.80 |
-1.33 |
|
| HDFC Bank Ltd. | 5.60 |
-1.21 |
|
| Infosys Ltd. | 3.38 |
-0.36 |
|
| Larsen And Toubro Ltd. | 3.31 |
-1.26 |
|
| Tata Consultancy Services Ltd. | 3.16 |
-0.35 |
|
| Reliance Industries Ltd. | 2.95 |
-0.42 |
|
| Bharti Airtel Ltd. | 2.78 |
-0.46 |
|
| NTPC Ltd. | 2.73 |
-0.80 |
|
| Axis Bank Ltd. | 1.89 |
-0.27 |
|
| Kotak Mahindra Bank Ltd. | 1.87 |
-0.14 |
|
| Ultratech Cement Ltd. | 1.77 |
||
| Bajaj Auto Ltd. | 1.65 |
-0.74 |
|
| Maruti Suzuki India Ltd. | 1.52 |
-0.55 |
|
| Tata Motors Ltd. | 1.24 |
-0.18 |
|
| Bharat Electronics Ltd. | 1.24 |
-0.38 |
|
| ITC Ltd. | 1.20 |
-0.24 |
|
| LTIMindtree Ltd. | 1.19 |
-0.12 |
|
| United Spirits Ltd. | 1.15 |
-0.38 |
|
| Hindalco Industries Ltd. | 1.12 |
-0.18 |
|
| Bajaj Finance Ltd. | 1.10 |
-0.18 |
|
| Titan Company Ltd. | 1.07 |
-0.29 |
|
| Interglobe Aviation Ltd | 1.06 |
-0.41 |
|
| Oil & Natural Gas Corporation Ltd. | 0.93 |
-0.45 |
|
| Godrej Consumer Products Ltd | 0.92 |
-0.37 |
|
| HDFC Asset Management Company Ltd | 0.90 |
-0.31 |
|
| Marico Ltd. | 0.86 |
-0.14 |
|
| Crompton Greaves Consumer Electricals Ltd. | 0.82 |
-0.18 |
|
| SBI Life Insurance Company Ltd. | 0.78 |
-0.26 |
|
| Info-Edge (India) Ltd. | 0.75 |
-0.10 |
|
| Dr. Lal Pathlabs Ltd. | 0.72 |
-0.10 |
|
| IndusInd Bank Ltd. | 0.71 |
-0.21 |
|
| Tata Steel Ltd. | 0.69 |
-0.69 |
|
| Eicher Motors Ltd | 0.67 |
-0.07 |
|
| Coforge Ltd | 0.67 |
-0.67 |
|
| ICICI Lombard General Insurance Company Ltd | 0.67 |
-0.06 |
|
| Coal India Ltd. | 0.66 |
-0.09 |
|
| Cipla Ltd. | 0.62 |
-0.06 |
|
| Havells India Ltd. | 0.60 |
-0.24 |
|
| Page Industries Ltd | 0.60 |
-0.06 |
|
| Mahindra & Mahindra Ltd. | 0.55 |
-0.07 |
|
| Torrent Pharmaceuticals Ltd. | 0.50 |
-0.07 |
|
| Syngene International Ltd. | 0.50 |
-0.05 |
|
| Balkrishna Industries Ltd. | 0.48 |
-0.48 |
|
| Avenue Supermarts Ltd. | 0.45 |
||
| Timken India Ltd. | 0.43 |
||
| Ajanta Pharma Ltd. | 0.36 |
||
| Hero Motocorp Ltd. | 0.30 |
||
| Dabur India Ltd. | 0.28 |
-0.28 |
|
| P I Industries Ltd. | 0.24 |
-0.02 |
|
| Endurance Technologies Ltd. | 0.24 |
||
| Hindustan Unilever Ltd. | 0.19 |
-0.19 |
|
| PNC Infratech Ltd | 0.19 |
||
| Dr Reddy's Laboratories Ltd. | 0.17 |
||
| Prince Pipes And Fittings Ltd | 0.17 |
||
| Inox India Ltd | 0.02 |
||
| Mahindra And Mahindra Financial Services Ltd | - |
0.06 |
|
| CP / CDs | |||
| Kotak Mahindra Bank | 2.81 |
CRISIL AAA/A1+ |
|
| DBS Bank | 1.76 |
IND AAA/A1+ |
|
| Small Industries Development Bank of India | 1.75 |
CARE AAA/A1+ |
|
| ICICI Bank | 0.88 |
ICRA AAA/A1+ |
|
| Govt Securities | |||
| 7.06% GS MAT - 10/04/2028 | 8.48 |
SOV |
|
| 7.38% GSEC 20/06/2027 | 5.71 |
SOV |
|
| NCDs | |||
| 7.80% UNSEC NABARD NCD Bonds Series 24E 15/03/2027 | 1.89 |
ICRA AAA/A1+ |
|
| 7.64% URNCD REC LTD - 30/062026 | 1.88 |
CRISIL AAA/A1+ |
|
| 7.69% SRNCD HDFC BANK SR-AB001-27/01/2033 | 1.88 |
CRISIL AAA/A1+ |
|
| 7.83% URNCD SIDBI SERIES-V MAT-24/11/2028 | 0.95 |
CRISIL AAA/A1+ |
|
| 7.79% URNCD SIDBI SERIES-VI MAT-14/05/2027 | 0.94 |
CRISIL AAA/A1+ |
|
| 7.57% URNCD IRFC (SR-175) - 18/04/2029 | 0.94 |
CRISIL AAA/A1+ |
|
| 7.43% URNCD SIDBI SERIES-IV MAT-31/08/2026 | 0.37 |
CRISIL AAA/A1+ |
|
| Net Current assets | 3.35 |
||
| Total | 100.00 |
||
% of top 10 stocks |
24.57 |
Median Market Cap ( Cr) |
203,143 |
Weighted Average Market Cap |
212,444 |
Number of Securities |
58 |
All figures given are provisional and unaudited. |
Fund |
Benchmark |
|
Beta |
0.76 |
1 |
Standard Deviation (Annual) |
8.16% |
9.51% |
Sharpe ratio |
1.13% |
|
| Portfolio Turnover Ratio (Annual) | 1.55 |
As on 31st January, 2024
| Fund Performance Vs Benchmark (CAGR) as on 31st January, 2024 Growth of 10000
|
||||||
| Period | NAV Growth (%) |
Benchmark@ (%) |
Nifty 50 TRI (%) |
NAV Growth () |
Benchmark@ () |
Nifty 50 TRI () |
| 1 Y | 34.18 |
22.45 |
24.35 |
13,418 |
12,245 |
12,435 |
| 3 Y | 16.08 |
15.14 |
18.19 |
15,641 |
15,264 |
16,510 |
| 5 Y | 12.88 |
14.97 |
16.29 |
18,333 |
20,095 |
21,276 |
| SI* | 12.61 |
14.80 |
16.26 |
60,869 |
81,585 |
98,873 |
Different plans have a different expense structure. The performance details provided herein are of regular plan.
@S&P BSE 200 TRI(65%), CRISIL Composite Bond Index (25%)& Price of Gold (10%)*Compounded annualized Growth Rate.
For performance details of other Schemes managed by the Fund Manager, please refer the respective Scheme sheets as listed Please click here in ‘Fund Manager Summary’. N.A - Not
Available. Schemes Managed by Mr. Sunil Madhukar Patil & Mr. Sharwan Kumar Goyal.
The performance of the benchmark is calculated using total return index variant of the benchmark index. Load is not taken into consideration for computation of performance.
| Period | |||||||
Investment Amount () |
Value- Fund () |
Benchmark@ () |
Nifty 50 () |
Yield (%) Fund |
Yield (%) Benchmark@ |
Yield (%) Nifty 50 |
|
| 1 Y | 120,000 |
145,120 |
137,322 |
138,471 |
40.82 |
27.71 |
29.62 |
| 3 Y | 360,000 |
485,780 |
451,259 |
459,553 |
20.44 |
15.22 |
16.50 |
| 5 Y | 600,000 |
914,359 |
894,497 |
947,510 |
16.86 |
15.97 |
18.32 |
| 7 Y | 840,000 |
1,360,902 |
1,406,274 |
1,496,823 |
13.54 |
14.46 |
16.20 |
| 10 Y | 1,200,000 |
2,166,874 |
2,421,161 |
2,594,881 |
11.37 |
13.45 |
14.74 |
| 15 Y | 1,800,000 |
4,140,835 |
5,081,886 |
5,566,777 |
10.36 |
12.76 |
13.82 |
| SI* | 1,810,000 |
4,201,006 |
5,154,071 |
5,652,471 |
10.40 |
12.78 |
13.85 |
Note: Systematic Investment Plan (SIP) returns are worked out assuming investment of 10,000/- every month at NAV per unit of the scheme as on the first working day for the respective time periods. The loads have not been taken into account. Past performance may or may not be sustained in future.
@S&P BSE 200 TRI (65%), CRISIL Composite Bond Index (25%) & Price of Gold(10%)
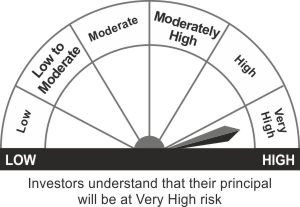
*Investors should consult their Mutual Fund Distributor if in doubt about whether the product is suitable for them.
- Long-term capital appreciation
- Investment in equity, debt and Gold ETFs with a minimum allocation of 10% in each asset class
*Investors should consult their financial advisers if in doubt about whether the product is suitable for them.