| Investment Objective The investment objective of the Scheme is to provide capital appreciation and income distribution to the investors using arbitrage opportunities, investment in equity / equity related instruments and debt / money market instruments. However, there is no assurance or guarantee that the investment objective of the Scheme would be achieved. |
|||
Inception Date |
30th August, 2018 | ||
Fund Manager |
Mr. V Srivatsa (Equity Portion) - B.Com., ACA, CWA, PGDM (IIM-I) Managing the scheme since Aug 2018 Mr. Sunil Madhukar Patil (Debt Portion), M.com.,MFM Managing the scheme since Aug 2018 |
||
Fund AUM |
Fund size monthly average : 327.89 Crore Closing AUM : 321.25 Crore |
||
High/Low NAV in the month |
High Growth Option : 16.2428 Low Growth Option : 16.0179 |
||
Total expense ratio (%) |
Regular : 1.52 Direct : 0.71 |
||
Minimum Investment Amount |
Growth: 5000/- IDCW: 5000/- |
Market Capitalisation (%) |
|
Load Structure |
Entry Load : Nil Exit Load (A) Redemption / Switch out within 12 months from the date of allotment – (i) upto 10% of the allotted Units – NIL (ii) beyond 10% of the allotted Units - 1.00 % (B) Redemption / Switch out after 12 months from the date of allotment – NIL |
||
NAV per unit as on 31st January, 2024 |
Regular Growth Option 16.2323 Regular IDCW Option 16.2323 Direct Growth Option 17.0296 Direct IDCW Option 17.0296 |
||
Plans/Options
(Regular/Direct) |
Growth Option Monthly IDCW/ Quarterly IDCW Option with Payout & Reinvestment Facility |
||
| Portfolio Parameters | Weighted Average Maturity : 6.15 yrs Yield to Maturity* :7.23% Modified Duration : 4.18 yrs Macaulay Duration : 4.35 yrs *Annualized Portfolio YTM – Yields of all securities are annualized |
||
Benchmark Index |
CRISIL Equity Savings Index | ||
| SIP/SWP/STRIP | |||
| Fund Size | 327.89 Crore (Monthly Average as on 31/1/2024) | ||
Overweight (Top 5) |
% of Nav |
Underweight (Top 5) |
% of Nav |
| ICICI Bank Ltd | 3.34 |
JSW Steel Ltd. | -0.01 |
| HDFC Bank Ltd. | 3.23 |
NMDC Ltd. | -0.01 |
| Infosys Ltd. | 2.78 |
Hindustan Unilever Ltd. | -0.01 |
| Reliance Industries Ltd. | 2.66 |
Tata Consultancy Services Ltd. | 0.00 |
| Larsen And Toubro Ltd. | 2.02 |
Dabur India Ltd. | 0.00 |
| Financial Services | 34% |
| Oil, Gas & Consumable Fuels | 13% |
| Information Technology | 10% |
| Automobile and Auto Components | 8% |
| Construction | 6% |
| Portfolio | % of Nav |
Rating |
Futures |
| Equity | |||
| Infosys Ltd. | 8.12 |
-5.35 |
|
| Grasim Industries Ltd. | 6.44 |
-5.18 |
|
| HDFC Bank Ltd. | 5.98 |
-2.75 |
|
| Kotak Mahindra Bank Ltd. | 5.62 |
-4.36 |
|
| ICICI Bank Ltd | 4.88 |
-1.53 |
|
| Axis Bank Ltd. | 3.74 |
-2.34 |
|
| Maruti Suzuki India Ltd. | 2.82 |
-2.78 |
|
| Reliance Industries Ltd. | 2.66 |
||
| SBI Life Insurance Company Ltd. | 2.58 |
-2.17 |
|
| JSW Steel Ltd. | 2.51 |
-2.52 |
|
| Larsen And Toubro Ltd. | 2.02 |
||
| HCL Technologies Ltd. | 2.02 |
-1.31 |
|
| Hindalco Industries Ltd. | 1.99 |
-1.32 |
|
| IndusInd Bank Ltd. | 1.87 |
-0.46 |
|
| Mahindra & Mahindra Ltd. | 1.74 |
-0.72 |
|
| NMDC Ltd. | 1.72 |
-1.73 |
|
| ITC Ltd. | 1.52 |
||
| Bharti Airtel Ltd. | 1.46 |
||
| Hindustan Unilever Ltd. | 1.25 |
-1.26 |
|
| Oil & Natural Gas Corporation Ltd. | 0.98 |
-0.54 |
|
| Interglobe Aviation Ltd | 0.93 |
||
| Aurobindo Pharma Ltd. | 0.86 |
||
| DLF Ltd. | 0.80 |
||
| Coal India Ltd. | 0.74 |
||
| State Bank Of India | 0.71 |
||
| Power Grid Corporation Of India Ltd | 0.71 |
||
| Tata Motors Ltd. | 0.68 |
||
| GAIL (India) Ltd. | 0.63 |
||
| Tata Consultancy Services Ltd. | 0.60 |
-0.61 |
|
| Hero Motocorp Ltd. | 0.59 |
||
| NTPC Ltd. | 0.58 |
||
| Cipla Ltd. | 0.53 |
||
| Bajaj Auto Ltd. | 0.50 |
||
| Dr Reddy's Laboratories Ltd. | 0.36 |
||
| Dabur India Ltd. | 0.19 |
-0.19 |
|
| Govt Securities | |||
| 07.18% GSEC MAT -24/07/2037 | 9.30 |
SOV |
|
| 7.06% GS MAT - 10/04/2028 | 3.11 |
SOV |
|
| 7.26% GSEC MAT - 06/02/2033 | 1.56 |
SOV |
|
| 364 DAYS T - BILL- 08/08/2024 | 1.50 |
SOV |
|
| 364 DAYS T - BILL- 07/03/2024 | 0.11 |
SOV |
|
| Long Term Debt | |||
| REC Ltd | 1.57 |
IND AAA/A1+ |
|
| LIC Housing Finance Ltd. | 1.56 |
CRISIL AAA/A1+ |
|
| Small Industries Development Bank Of India | 1.55 |
CRISIL AAA/A1+ |
|
| Power Finance Corporation Ltd. | 1.54 |
CRISIL AAA/A1+ |
|
| Indian Railway Finance Corporation Ltd. | 1.54 |
CRISIL AAA/A1+ |
|
| Net Current Assets | 5.34 |
||
| Total | 100.00 |
| % of Top 10 Stocks | 21.07 |
Median Market Cap ( Cr) |
488,127 |
Weighted Average Market Cap |
564,641 |
Number of Securities |
37 |
All figures given are provisional and unaudited. |
Fund |
Benchmark |
|
Beta |
0.97 |
1 |
Standard Deviation (Annual) |
5.50% |
5.30% |
Sharpe ratio |
0.99% |
|
| Portfolio Turnover Ratio (Annual) | 4.34 |
| Fund Performance Vs Benchmark (CAGR) as on 31st January, 2024 Growth of 10000
|
||||||
| Period | NAV Growth (%) |
CRISIL Equity Savings Index (%) |
CRISIL 10 Year Gilt Index (%) |
NAV Growth () |
CRISIL Equity Savings Index () |
CRISIL 10 Year Gilt Index () |
| 1 Y | 17.20 |
13.36 |
8.25 |
11,720 |
11,336 |
10,825 |
| 3 Y | 12.27 |
10.44 |
3.39 |
14,151 |
13,470 |
11,052 |
| 5 Y | 10.42 |
10.68 |
5.98 |
16,419 |
16,614 |
13,372 |
| SI* | 9.34 |
9.74 |
6.68 |
16,232 |
16,556 |
14,202 |
Different plans have a different expense structure. The performance details provided herein are of regular plan.
The current fund manager is managing the scheme since August-2018
*Compounded annualized Growth Rate.
For performance details of other Schemes managed by the Fund Manager, please refer the respective Scheme sheets as listed in Please click here in ‘Fund Manager Summary’.
Schemes Managed by Mr. V Srivatsa is & Mr. Sunil Madhukar Patil.
The performance of the benchmark is calculated using total return index variant of the benchmark index. Load is not taken into consideration for computation of performance.
| Period | |||||||
Investment Amount () |
Value- Fund () |
CRISIL Equity Savings Index () |
CRISIL 10 Year Gilt Index () |
Yield (%) Fund |
Yield (%) CRISIL Equity Savings Index |
Yield (%) CRISIL 10 Year Gilt Index |
|
| 1 Y | 120,000 |
132,079 |
129,409 |
124,901 |
19.11 |
14.80 |
7.63 |
| 3 Y | 360,000 |
433,664 |
420,122 |
390,016 |
12.46 |
12.27 |
5.27 |
| 5 Y | 600,000 |
814,610 |
790,437 |
678,165 |
12.18 |
11.58 |
4.84 |
| SI | 650,000 |
896,352 |
874,363 |
747,531 |
11.78 |
11.37 |
5.10 |
Note: Systematic Investment Plan (SIP) returns are worked out assuming investment of 10,000/- every month at NAV per unit of the scheme as on the first working day for the respective time periods. The loads have not been taken into account. Past performance may or may not be sustained in future.
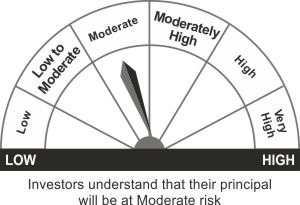
*Investors should consult their Mutual Fund Distributor if in doubt about whether the product is suitable for them.
- Long-term capital appreciation and income
- Investment in equity & equity related instruments, arbitrage opportunities, and investments in debt and money market opportunities
*Investors should consult their financial advisers if in doubt about whether the product is suitable for them.