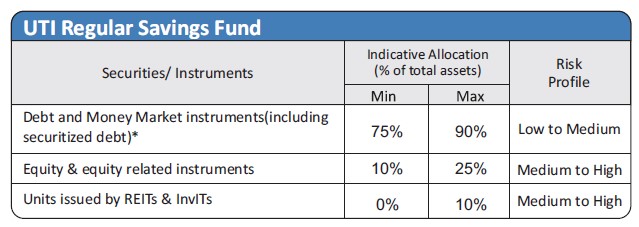
| Investment Objective The primary objective of the scheme is to invest predominantly in debt and money market instruments and part of the portfolio into equity/equity related securities with a view to generating income and aim for capital appreciaton. However, there can be no assurance or guarantee that the investment objective of the scheme would be achieved. |
|||||||||
| Inception Date |
16th December, 2003 | ||||||||
| Fund Manager |
Mr. Amit Premchandani, PGDM (IIM Indore), CA, CFA (Equity Porfolio) Managing the scheme since Jan 2022 Mr. Jaydeep Bhowal Debt Porfolio) Managing the scheme since Apr 2023 | ||||||||
| Fund AUM |
Fund size monthly average : 1576.74 Crore Closing AUM :1576.48 Crore |
||||||||
| High/Low NAV in the month |
High Growth Option : 59.9762 Low Growth Option : 59.4475 |
||||||||
Total expense ratio (%) |
Regular : 1.80 Direct : 1.20 |
||||||||
Minimum Investment Amount |
Growth Plan: 5000/- Monthly IDCW Option: 25000/- Flexi IDCW Option: 5000/- |
||||||||
Plans/Options
(Regular / Direct) |
Growth Option Monthly IDCW Option,Flexi IDCW Option, Monthly Payment Plan |
||||||||
| Portfolio Parameters | Weighted Average Maturity : 8.58 Yrs Yield to Maturity* : 7.59% Modified Duration : 4.65 yrs Macaulay Duration : 4.92 yrs *Annualized Portfolio YTM – Yields of all securities are annualized |
||||||||
Load Structure |
Entry Load : Nil Exit Load (A) Redemption / Switch out within 12 months from the date of allotment – (i) upto 10% of the allotted Units – NIL (ii) beyond 10% of the allotted Units - 1.00 % (B) Redemption / Switch out after 12 months from the date of allotment – NIL |
||||||||
NAV per unit as on 31st January, 2024 |
Regular Growth Option 59.9762 Regular IDCW Option 16.5037 Direct Growth Option 64.3290 Direct IDCW Option 18.2443 |
||||||||
| Options Available | SIP & SWP | ||||||||
| Market Capitalisation (%) |
|
||||||||
Segregated AUM & NAV |
Segregated Fund Size Monthly Average : 0.0 Crore Closing AUM: 0.0 Crore Segregated NAV per unit as on 31st January, 2024 Growth : 0.0 |
||||||||
Benchmark Index |
NIFTY 50 Hybrid Composite Debt 15:85 Index | ||||||||
| Fund Size | 1576.74 Crore (Monthly Average as on 31/1/2024) | ||||||||
UTI Conservative Hybrid Fund (Erstwhile UTI Regular Savings Fund) - IDCW - Regular Plan |
||||||
declared - Last 10 Months IDCW (Recent IDCWs) |
||||||
Year |
IDCW |
Per unt |
NAV (Cum Div ) |
Face Value (per unit) |
NAV Date |
Record Date |
2022 |
0.80% |
0.080 |
15.7325 |
10.00 |
25-04-2022 |
02-05-2022 |
2022 |
0.80% |
0.080 |
15.3382 |
10.00 |
25-05-2022 |
01-06-2022 |
2022 |
0.80% |
0.080 |
15.1732 |
10.00 |
23-06-22 |
01-07-2022 |
2022 |
0.80% |
0.080 |
15.7457 |
10.00 |
25-08-22 |
01-09-2022 |
2022 |
0.80% |
0.080 |
15.5558 |
10.00 |
26-09-22 |
03-10-2022 |
2022 |
0.80% |
0.080 |
15.7971 |
10.00 |
24-11-22 |
01-12-2022 |
2022 |
0.80% |
0.080 |
15.6997 |
10.00 |
26-12-22 |
02-01-2023 |
2023 |
0.80% |
0.080 |
15.6514 |
10.00 |
25-01-23 |
01-02-2023 |
2023 |
0.80% |
0.080 |
15.5502 |
10.00 |
23-02-23 |
01-03-2023 |
2023 |
0.80% |
0.080 |
15.3814 |
10.00 |
27-03-23 |
03-04-2023 |
2023 |
0.80% |
0.080 |
15.5716 |
10.00 |
25-04-23 |
02-05-2023 |
2023 |
0.80% |
0.080 |
15.8078 |
10.00 |
26-05-23 |
01-06-2023 |
2023 |
0.80% |
0.080 |
15.5716 |
10.00 |
25-04-23 |
02-05-23 |
2023 |
0.80% |
0.080 |
16.0742 |
10.00 |
26-09-23 |
03-10-23 |
2023 |
0.80% |
0.080 |
15.8457 |
10.00 |
26-10-23 |
01-11-23 |
2023 |
0.80% |
0.080 |
16.1000 |
10.00 |
24-11-23 |
01-12-23 |
2023 |
0.80% |
0.080 |
16.1000 |
10.00 |
24-11-23 |
01-12-23 |
2023 |
12.00 |
1.20 |
40.752 |
10.00 |
06-12-23 |
12-12-23 |
2023 |
0.80% |
0.080 |
16.4180 |
10.00 |
26-12-23 |
01-01-24 |
2023 |
0.80% |
0.0800 |
16.4036 |
10.00 |
25-01-24 |
01-02-24 |
Disclaimer: Pursuant to payment of Dividend/Bonus, the Nav of the income distribution cum capital withdrawal options of the schemes would fall to the extent of payout and statutory levy (if applicable)
@@ NAV
of Monthly IDCW Option - Regular Plan
The Scheme IDCW details under regular plan.
| Financial Services | 32% |
| Information Technology | 12% |
| Healthcare | 9% |
| Automobile and Auto Components | 9% |
| Oil, Gas & Consumable Fuels | 7% |
(Main Portfolio) |
% of Nav |
Rating |
| Equity | ||
| HDFC Bank Ltd. | 2.18 |
|
| ICICI Bank Ltd | 1.39 |
|
| Infosys Ltd. | 1.34 |
|
| Axis Bank Ltd. | 1.05 |
|
| Bharti Airtel Ltd. | 1.00 |
|
| State Bank Of India | 0.77 |
|
| Kotak Mahindra Bank Ltd. | 0.72 |
|
| Hindalco Industries Ltd. | 0.66 |
|
| Tech Mahindra Ltd | 0.66 |
|
| Coal India Ltd. | 0.63 |
|
| Others | 14.44 |
|
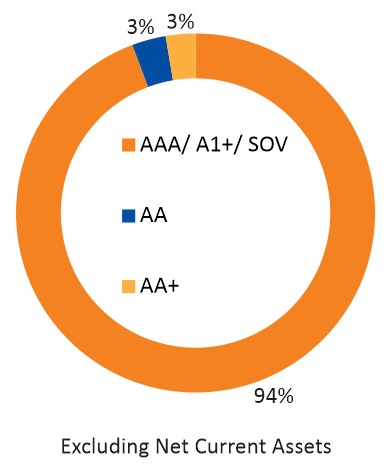
| Govt Securities | ||
| 07.18% GSEC MAT -14/08/2033 | 12.91 |
SOV |
| 7.06% GS MAT - 10/04/2028 | 7.93 |
SOV |
| 7.70% MH SGS MAT - 15/11/2034 | 1.92 |
SOV |
| 7.73% UPS SGS MAT - 08/11/2033 | 1.60 |
SOV |
| 07.18% GSEC MAT -24/07/2037 | 1.58 |
SOV |
| 7.71% MH SGS MAT - 08/11/2033 | 0.96 |
SOV |
| 7.26% GSEC 14/01/29 | 0.96 |
SOV |
| 364 DAYS T - BILL- 07/03/2024 | 0.16 |
SOV |
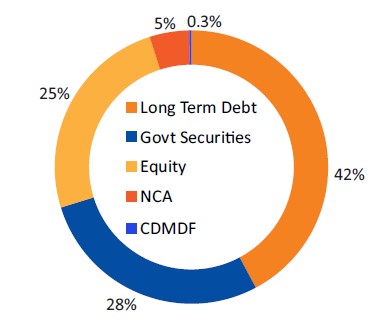
| Long Term Debt | ||
| National Bank For Agriculture And Rural Development | 6.33 |
CRISIL AAA/A1+ |
| Small Industries Development Bank Of India | 6.03 |
CRISIL AAA/A1+ |
| Jamnagar Utilities And Power Private Ltd. ^ | 5.33 |
CRISIL AAA/A1+ |
| REC Ltd | 4.76 |
CRISIL AAA/A1+ |
| Power Finance Corporation Ltd. | 4.75 |
CRISIL AAA/A1+ |
| HDFC Bank Ltd. | 4.69 |
CRISIL AAA/A1+ |
| Indian Railway Finance Corporation Ltd. | 3.15 |
CRISIL AAA/A1+ |
| LIC Housing Finance Ltd. | 3.15 |
CRISIL AAA/A1+ |
| State Bank Of India Basel3At1 | 1.88 |
CRISIL AA+ |
| Tata Projects Ltd | 1.59 |
IND AA |
| Piramal Capital And Housing Finance Ltd. | 0.56 |
ICRA AA |
| Corporate Debt Market Development Fund | ||
| Corporate Debt Market Devt Fund - A2 Units | 0.25 |
|
| Net Current assets | 4.67 |
|
| Total | 100.00 |
^ Mukesh Ambani promoter Group company
Date |
Main Portfolio |
Segregated Portfolio |
14-02-2020 |
41.6229 |
NA |
17-02-2020 |
40.5238 |
0.3570 |
Reduction in NAV(%) |
-2.64% |
Portfolio |
% of NAV |
Rating |
Vodafone Idea Ltd |
0* |
CARE-B- |
Net Current Assets |
0* |
|
| * Percentage to NAV Less Than 0.01 |
Median Market Cap ( Cr) |
133,888 |
Weighted Average Market Cap |
308,378
|
Number of Securities |
54 |
All figures given are provisional and unaudited. |
Quantitative Indicators |
Fund |
Benchmark |
Beta |
1.14 |
1 |
Standard Deviation (Annual) |
3.77% |
2.85% |
Sharpe ratio |
0.73% |
|
| Portfolio Turnover Ratio (Annual) | 0.27 |
| Fund Performance Vs Benchmark (CAGR) as on 31st January, 2024 Growth of 10000 |
||||||
| Period | NAV Growth (%) |
NIFTY 50 Hybrid Composite Debt 15:85 Index TRI (%) |
CRISIL 10 Year Gilt Index (%) |
NAV Growth () |
NIFTY 50 Hybrid Composite Debt 15:85 Index TRI () |
CRISIL 10 Year Gilt Index () |
| 1 Y | 12.24 |
10.20 |
8.25 |
11,224 |
11,020 |
10,825 |
| 3 Y | 9.58 |
7.02 |
3.39 |
13,158 |
12,257 |
11,052 |
| 5 Y | 8.25 |
9.09 |
5.98 |
14,867 |
15,454 |
13,372 |
| SI* | 9.30 |
8.42 |
5.58 |
59,951 |
50,944 |
29,849 |
Different plans have a different expense structure. The performance details provided herein are of regular plan.
*Compounded annualized Growth Rate.
The current fund manager is managing the scheme since Jul 2004 & Co- Fund Manager managing Scheme since Dec 2014.
For performance details of other Schemes managed by the Fund Manager, please refer the respective Scheme sheets as listed in page Please click here in ‘Fund Manager Summary’. Schemes Managed by Mr. Amit Premchandani & Mr. Jaydeep Bhowal. *The Scheme returns are inclusive of the impact of segregation of the portfolio Debt instruments of Vodafone Idea Ltd. have been segregated from the Main Portfolio on Feb 17, 2020. Load is not taken into consideration for computation of performance.
| Period | |||||||
|
Investment Amount ()
|
Value- Fund
() |
NIFTY 50 Hybrid
Composite Debt 15:85 Index TRI () |
CRISIL 10 Year
Gilt Index () |
Yield (%) Fund
|
Yield (%) NIFTY 50 Hybrid
Composite Debt 15:85 Index TRI |
Yield (%)
CRISIL 10 Year Gilt Index |
|
1 Y |
120,000 |
128,630 |
126,814 |
124,901 |
13.55 |
10.66 |
7.63 |
3 Y |
360,000 |
414,661 |
403,873 |
390,039 |
9.39 |
7.61 |
5.27 |
5 Y |
600,000 |
765,670 |
737,645 |
678,251 |
9.68 |
8.19 |
4.85 |
7 Y |
840,000 |
1,138,835 |
1,132,548 |
1,015,731 |
8.55 |
8.40 |
5.34 |
10 Y |
1,200,000 |
1,847,506 |
1,867,510 |
1,624,571 |
8.36 |
8.56 |
5.90 |
15 Y |
1,800,000 |
3,623,750 |
3,612,014 |
2,925,427 |
8.77 |
8.73 |
6.18 |
SI |
2,300,000 |
5,856,350 |
5,738,209 |
4,357,891 |
8.94 |
8.76 |
6.25 |
Note: Systematic Investment Plan (SIP) returns are worked out assuming investment of 10,000/- every month at NAV per unit of the scheme as on the first working day for the respective time periods. The loads have not been taken into account. Past performance may or may not be sustained in future.
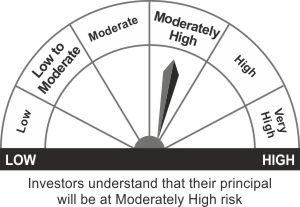
*Investors should consult their Mutual Fund Distributor if in doubt about whether the product is suitable for them.
- Long-term capital appreciation and regular income over medium-term
- Investment in equity instruments (maximum 25%) and fixed income securities (debt and money market securities)
*Investors should consult their financial advisers if in doubt about whether the product is suitable for them.