| Investment Objective The objective of the scheme is to generate capital appreciation through arbitrage opportunities between cash and derivatives market and arbitrage opportunities within the derivative segment and by deployment of surplus cash in debt securities and money market instruments. However, there can be no assurance or guarantee that the investment objective of the scheme would be achieved. |
|
Inception Date |
22nd June, 2006 |
Fund Manager |
Mr. Sharwan Kumar Goyal (For Equity Portion) Managing the scheme since Dec 2020 & Mr. Amit Sharma (For Debt Portion) Managing the scheme since Jul 2018 |
Fund AUM |
Fund size monthly average : 4450.35 Crore Closing AUM :4471.67 Crore |
High/Low NAV in the month |
High Growth Option : 31.6924 Low Growth Option : 31.4616 |
Total expense ratio (%) |
Regular : 0.90 Direct : 0.36 |
Minimum Investment Amount |
Growth, 5,000/- IDCW: 5,000/- |
Plans/Options
(Regular / Direct) |
Growth Option IDCW Option with Payout and Reinvestment |
Load Structure |
Entry Load : Nil |
NAV per unit as on 31st January, 2024 |
Regular Growth Option 31.6924 Regular IDCW Option 17.9038 Direct Growth Option 33.4913 Direct IDCW Option 19.5910 |
Portfolio Parameters |
Weighted Average Maturity : 0.21 yrs Yield to Maturity* : 7.62% Modified Duration : 0.21 yrs Macaulay Duration : 0.21 yrs *Annualized Portfolio YTM – Yields of all securities are annualized |
Benchmark Index |
Nifty 50 Arbitrage Index |
| Fund Size | 4450.35 Crore (Monthly Average as on 31/1/2024) |
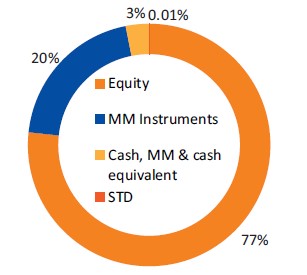
Portfolio |
% to
NAV |
Hedged |
Equity |
76.68 |
|
Debt |
0.00 |
|
MM Instruments |
20.22 |
|
| MF Units | ||
STD |
0.01 |
|
Cash, MM & cash equivalent |
3.08 |
|
Total |
100.00 |
|
All figures given are provisional and unaudited.
Average Equity holding in UTI Arbitrage Fund is 71.73% for the past 12 months against the requirement of minimum 65% for equity taxation eligibility.
(Annual average of the monthly average opening and closing figures)
Quantitative Indicators |
Fund |
Benchmark |
Beta |
0.27 |
1 |
Standard Deviation (Annual) |
0.89% |
1.60% |
Sharpe ratio |
-1.80% |
|
| Portfolio Turnover Ratio (Annual) | 12.84 |
| Fund Performance Vs Benchmark (CAGR) as on 31st January, 2024 Growth of 10000
|
||||||
| Period | NAV Growth (%) |
Nifty 50 Arbitrage TRI (%) |
CRISIL 1 Year T-Bill Index (%) |
NAV Growth () |
Nifty 50 Arbitrage TRI () |
CRISIL 1 Year T-Bill Index () |
| 1 Y | 7.62 |
8.45 |
6.91 |
10,762 |
10,845 |
10,691 |
| 3 Y | 5.25 |
5.72 |
5.00 |
11,659 |
11,816 |
11,576 |
| 5 Y | 5.17 |
5.11 |
5.55 |
12,868 |
12,832 |
13,103 |
| SI* | 6.76 |
6.21 |
6.14 |
31,667 |
28,912 |
28,578 |
Different plans have a different expense structure. The performance details provided herein are of regular plan.
The current fund manager is managing the scheme since Dec 2020 & July 2018
*Compounded annualized Growth Rate.
Benchmark for UTI Arbitrage Fund has been changed from CRISIL Arbitrage Index to Nifty 50 Arbitrage TRI. For performance details of other Schemes managed by the Fund Manager, please refer the respective Scheme sheets as listed in page Please click here‘Fund Manager Summary’. Schemes Managed by Mr. Sharwan Kumar Goya & Mr. Amit Sharma. The performance of the benchmark is calculated using total return index variant of the benchmark index. Load is not taken into consideration for computation of performance.
| Period | |||||||
Investment Amount () |
Fund
Value () |
Nifty 50 Arbitrage TRI () |
CRISIL 1 Year T-Bill Index () |
Yield (%) Fund |
Yield (%) Nifty 50 Arbitrage TRI |
Yield (%) CRISIL 1 Year T-Bill Index |
|
1 Y |
120,000 |
124,890 |
125,312 |
124,514 |
7.62 |
8.28 |
7.02 |
3 Y |
360,000 |
394,432 |
397,137 |
392,852 |
6.02 |
6.47 |
5.75 |
5 Y |
600,000 |
686,860 |
689,320 |
686,742 |
5.35 |
5.49 |
5.34 |
7 Y |
840,000 |
1,015,571 |
1,012,732 |
1,024,269 |
5.34 |
5.26 |
5.58 |
10 Y |
1,200,000 |
1,592,368 |
1,572,772 |
1,624,431 |
5.52 |
5.28 |
5.90 |
15 Y |
1,800,000 |
2,892,386 |
2,506,732 |
2,934,275 |
6.04 |
5.72 |
6.21 |
SI |
2,100,000 |
3,747,255 |
NA |
3,733,672 |
6.24 |
NA |
6.21 |
Note: Systematic Investment Plan (SIP) returns are worked out assuming investment of 10,000/- every month at NAV per unit of the scheme as on the first working day for the respective time periods. The loads have not been taken into account. Past performance may or may not be sustained in future.
Median Market Cap ( Cr) |
76,337 |
Weighted Average Market Cap |
296,480 |
Number of Securities |
146 |
| All figures given are provisional and unaudited. | |
UTI Arbitrage Fund (Formerly known as UTI Spread Fund) IDCW Declared - Last 10 Months IDCWs |
||||||
(Recent IDCWs)
|
||||||
Year |
IDCW |
Per unt |
NAV (Cum Div) |
Face Value (per unit) |
NAV Date |
Record Date |
2020 |
0.80% |
0.080 |
15.9591 |
10.00 |
29-06-2020 |
06-07-2020 |
2020 |
0.80% |
0.080 |
15.8805 |
10.00 |
29-07-2020 |
05-08-2020 |
2020 |
0.70% |
0.070 |
15.8518 |
10.00 |
31-08-2020 |
07-09-2020 |
2020 |
0.70% |
0.070 |
15.8206 |
10.00 |
29-10-2020 |
05-11-2020 |
2020 |
0.70% |
0.070 |
15.7670 |
10.00 |
27-11-2020 |
07-12-2020 |
2021 |
0.70% |
0.070 |
15.7462 |
10.00 |
30/12/2020 |
06/01/2021 |
2021 |
0.60% |
0.060 |
15.7017 |
10.00 |
01/02/2021 |
08/02/2021 |
2021 |
0.50% |
0.050 |
15.6864 |
10.00 |
01/03/2021 |
08/03/2021 |
2021 |
0.50% |
0.050 |
15.7097 |
10.00 |
31/03/2021 |
07/04/2021 |
2021 |
0.50% |
0.050 |
15.7253 |
10.00 |
03/05/2021 |
10/05/2021 |
2021 |
0.50% |
0.050 |
15.7461 |
10.00 |
31/05/2021 |
07/06/2021 |
2021 |
0.50% |
0.050 |
15.7642 |
10.00 |
30-06-2021 |
07-07-2021 |
2021 |
0.50% |
0.050 |
15.7656 |
10.00 |
02-08-2021 |
09-08-2021 |
2021 |
0.50% |
0.050 |
15.7694 |
10.00 |
01-09-2021 |
08-09-2021 |
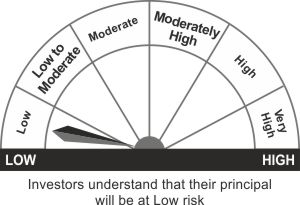
*Investors should consult their Mutual Fund Distributor if in doubt about whether the product is suitable for them.
- Capital appreciation over medium to long term
- Takes advantage of arbitrage opportunities in cash and derivative market without taking any directional/unhedged position in either equity or derivative instruments
*Investors should consult their financial advisers if in doubt about whether the product is suitable for them.