| Investment Objective The primary objective of the scheme is to generate long term capital appreciation by investing predominantly in equity and equity related securities of companies across the market capitalization spectrum. The fund also invests in debt and money market instruments with a view to generate regular income. However, there is no assurance or guarantee that the investment objective of the Scheme would be achieved. |
|||||||||
Inception Date |
2nd January, 1995 | ||||||||
Fund Manager |
Mr. V Srivatsa (Equity Portion) - B.Com., ACA, CWA, PGDM (IIM-I) Managing the scheme since Nov 2009 & Mr. Sunil Madhukar Patil (Debt Portion), M.com.,MFM Managing the scheme since Feb 2018 | ||||||||
Fund AUM |
Fund size monthly average : 5245.83 Crore Closing AUM :5291.85 Crore |
||||||||
High/Low NAV in the month |
High Growth Option : 335.8894 Low Growth Option : 327.2480 |
||||||||
Total expense ratio (%) |
Regular : 1.92 Direct : 1.29 |
||||||||
Minimum Investment Amount |
Growth: 1000/- IDCW: 5000/- |
||||||||
Plans/Options
(Regular / Direct) |
Growth Option IDCW Option with Payout and Reinvestment |
||||||||
| Market Capitalisation (%) |
|
||||||||
| Portfolio Parameters | Weighted Average Maturity : 11.92 Yrs Yield to Maturity* : 7.51% Modified Duration : 5.85 Yrs Macaulay Duration: 6.13 Yrs *Annualized Portfolio YTM – Yields of all securities are annualized |
||||||||
Load Structure |
Nil (A) Redemption / Switch out within 12 months from the date of allotment – (i) upto 10% of the allotted Units – NIL (ii) beyond 10% of the allotted Units - 1.00 % (B) Redemption / Switch out after 12 months from the date of allotment – NIL |
||||||||
NAV per unit as on 31st January, 2024 |
Regular Growth Option 334.0207 Regular IDCW Option 40.2821 Direct Growth Option 355.9157 Direct IDCW Option 44.0907 |
||||||||
| Options Available | SIP | ||||||||
Benchmark Index |
CRISIL Hybrid 35+65 Aggressive Index | ||||||||
| SIP/SWP/STRIP | |||||||||
| Fund Size | 5245.83 Crore (Monthly Average as on 31/1/2024) | ||||||||
UTI Aggressive Hybrid Fund (Erstwhile UTI Hybrid Equity Fund) - IDCW History
(Recent IDCW) |
|||
Year |
IDCW % |
NAV / Face
Value |
Record Date |
2017 |
2.70% |
30.67/10 |
22-08-2017 |
2017 |
2.70% |
31.21/10 |
20-09-2017 |
2017 |
2.70% |
30.99/10 |
16-10-2017 |
2017 |
2.70% |
31.47/10 |
20-11-2017 |
2017 |
2.70% |
31.55/10 |
18-12-2017 |
2018 |
2.70% |
32.43/10 |
17-01-2018 |
2018 |
4.00% |
30.46/10 |
26-02-2018 |
2018 |
2.70% |
32.01/10 |
07-02-2018 |
2018 |
2.70% |
29.98/10 |
21-03-2018 |
2018 |
2.70% |
29.85/10 |
19-04-2018 |
2018 |
2.70% |
29.64/10 |
21-05-2018 |
2018 |
2.70% |
29.29/10 |
21-06-2018 |
2018 |
2.30% |
29.13/10 |
23-08-2018 |
2018 |
2.30% |
28.96/10 |
25-09-2018 |
2018 |
2.30% |
27.20/10 |
23-10-2018 |
2018 |
2.30% |
27.02/10 |
22-11-2018 |
2018 |
1.10% |
27.25/10 |
26-12-2018 |
2019 |
1.10% |
27.16/10 |
22-01-2019 |
2019 |
1.10% |
25.87/10 |
21-02-2019 |
2019 |
1.10% |
27.29/10 |
25-03-2019 |
2019 |
2.10% |
27.65/10 |
22-04-2019 |
2019 |
2.10% |
26.13/10 |
22-05-2019 |
2019 |
2.10% |
26.46/10 |
24-06-2019 |
2019 |
2.10% |
26.71/10 |
24-07-2019 |
2019 |
2.10% |
25.01/10 |
27-08-2019 |
2019 |
2.10% |
24.82/10 |
25-09-2019 |
2019 |
1.70% |
24.66/10 |
22-10-2019 |
2019 |
1.70% |
25.27/10 |
25-11-2019 |
2019 |
1.70% |
25.28/10 |
23-12-2019 |
2020 |
1.70% |
26.05/10 |
22-01-2020 |
2020 |
1.70% |
25.13/10 |
24-02-2020 |
2020 |
3.90% |
24.11/10 |
27-08-2020 |
2020 |
3.90% |
24.63/10 |
11-11-2020 |
2021 |
4.70% |
30.12/10 |
15-02-2021 |
2021 |
4.70% |
30.65/10 |
17-05-2021 |
2021 |
6.00% |
33.03/10 |
18-08-2021 |
2021 |
6.00% |
35.68/10 |
22-11-2021 |
2022 |
6.00% |
33.65/10 |
22-02-2022 |
2022 |
6.00% |
31.04/10 |
23-05-2022 |
2022 |
6.00% |
33.02/10 |
17-08-2022 |
2022 |
6.80% |
33.44/10 |
17-11-2022 |
2023 |
6.80% |
33.00/10 |
17-02-2023 |
2023 |
7.40% |
37.78/10 |
23-11-2023 |
The scheme IDCW details under regular plan.
Disclaimer: Pursuant to payment of Dividend/Bonus, the Nav of the income distribution cum capital withdrawal options of the schemes would fall to the extent of payout and statutory levy (if applicable)
| Financial Services | 32% |
| Automobile and Auto Components | 11% |
| Information Technology | 11% |
| Oil, Gas & Consumable Fuels | 11% |
| Healthcare | 9% |
Portfolio |
% of Nav |
Rating |
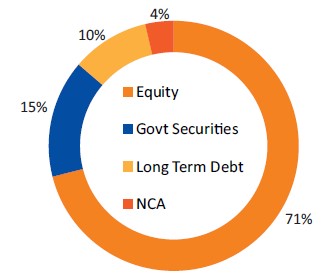
| Equity | ||
| HDFC Bank Ltd. | 6.61 |
|
| ICICI Bank Ltd | 5.41 |
|
| Reliance Industries Ltd. | 4.86 |
|
| Infosys Ltd. | 4.36 |
|
| Larsen And Toubro Ltd. | 3.33 |
|
| ITC Ltd. | 2.72 |
|
| Mahindra & Mahindra Ltd. | 2.34 |
|
| IndusInd Bank Ltd. | 1.91 |
|
| HCL Technologies Ltd. | 1.85 |
|
| Axis Bank Ltd. | 1.85 |
|
| Bharti Airtel Ltd. | 1.83 |
|
| Tata Motors Ltd. | 1.67 |
|
| GAIL (India) Ltd. | 1.59 |
|
| State Bank Of India | 1.58 |
|
| Hindalco Industries Ltd. | 1.43 |
|
| Others | 27.73 |
|
| Govt Securities | ||
| Others | 0.79 |
|
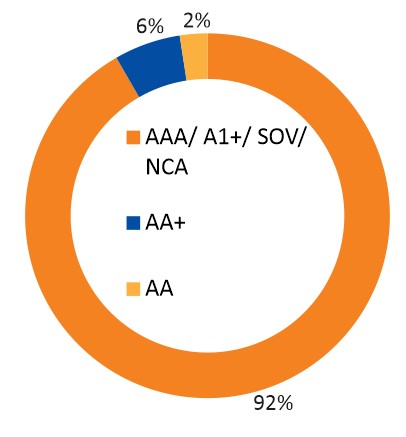
| 7.26% GSEC MAT - 06/02/2033 | 4.75 |
SOV |
| 07.18% GSEC MAT -24/07/2037 | 4.70 |
SOV |
| 7.41% GS MAT - 19/12/2036 | 2.40 |
SOV |
| 07.30% GSEC MAT -19/06/2053 | 1.42 |
SOV |
| 07.18% GSEC MAT -14/08/2033 | 1.17 |
SOV |
| Long Term Debt | ||
| REC Ltd | 1.89 |
CRISIL AAA/A1+ |
| Power Finance Corporation Ltd. | 1.42 |
CRISIL AAA/A1+ |
| HDFC Bank Ltd. | 0.95 |
CRISIL AAA/A1+ |
| Canara Bank Basel3At1 | 0.76 |
CRISIL AA+ |
| Shriram Finance Ltd | 0.57 |
CRISIL AA+ |
| Small Industries Development Bank Of India | 0.47 |
CRISIL AAA/A1+ |
| Mahindra And Mahindra Financial Services Ltd | 0.47 |
CRISIL AAA/A1+ |
| HDFC Bank Ltd. Basel3T2 | 0.47 |
CRISIL AAA/A1+ |
| Jamnagar Utilities And Power Private Ltd. ^ | 0.47 |
CRISIL AAA/A1+ |
| HDB Financial Services Ltd. | 0.47 |
CRISIL AAA/A1+ |
| Others | 2.12 |
|
| Net Current assets | 3.66 |
|
| Total | 100.00 |
|
| ^ Mukesh Ambani promoter Group company | ||
Median Market Cap ( Cr) |
215,852 |
Weighted Average Market Cap |
459,611 |
Number of Securities |
61 |
All figures given are provisional and unaudited. |
Quantitative Indicators |
Fund |
Benchmark |
Beta |
1.09 |
1 |
Standard Deviation (Annual) |
10.73% |
9.51% |
Sharpe ratio |
1.26% |
|
| Portfolio Turnover Ratio (Annual) | 0.29 |
| Fund Performance Vs Benchmark (CAGR) as on 31st January, 2024 Growth of 10000
|
||||||
| Period | NAV Growth (%) |
CRISIL Hybrid 35+65 Aggressive Index (%) |
Nifty 50 TRI (%) |
NAV Growth () |
CRISIL Hybrid 35+65 Aggressive Index () |
Nifty 50 TRI () |
| 1 Y | 27.92 |
22.40 |
24.35 |
12,792 |
12,240 |
12,435 |
| 3 Y | 20.39 |
15.06 |
18.19 |
17,449 |
15,233 |
16,510 |
| 5 Y | 15.53 |
14.63 |
16.29 |
20,589 |
19,799 |
21,276 |
| SI* | 14.84 |
NA |
NA |
560,567 |
NA |
NA |
*Compounded annualized Growth Rate.
For performance details of other Schemes managed by the Fund Manager, please refer the respective Scheme sheets as listed in Please click here in ‘Fund Manager Summary’. N.A - Not Available Schemes Managed by Mr. V Srivatsa & Mr. Sunil Madhukar Patil.
The performance of the benchmark is calculated using total return index variant of the benchmark index. Load is not taken into consideration for computation of performance.
| Period | |||||||
Investment Amount () |
Value- Fund () |
CRISIL Hybrid 35+65 Aggressive Index () |
Nifty 50 () |
Yield (%) Fund |
Yield (%) CRISIL Hybrid 35+65 Aggressive Index |
Yield (%) Nifty 50 |
|
1 Y |
120,000 |
140,481 |
137,049 |
138,471 |
32.98 |
27.26 |
29.62 |
3 Y |
360,000 |
476,562 |
448,350 |
459,553 |
19.07 |
14.77 |
16.50 |
5 Y |
600,000 |
975,016 |
889,808 |
947,510 |
19.49 |
15.75 |
18.32 |
7 Y |
840,000 |
1,465,268 |
1,390,839 |
1,496,823 |
15.61 |
14.15 |
16.20 |
10 Y |
1,200,000 |
2,451,017 |
2,399,210 |
2,594,881 |
13.68 |
13.28 |
14.74 |
15 Y |
1,800,000 |
5,157,834 |
5,059,633 |
5,566,777 |
12.93 |
12.71 |
13.82 |
SI* |
2,300,000 |
8,572,714 |
8,546,417 |
9,702,353 |
12.30 |
12.28 |
13.37 |
Note: Systematic Investment Plan (SIP) returns are worked out assuming investment of 10,000/- every month at NAV per unit of the scheme as on the first working day for the respective time periods. The loads have not been taken into account.*Since inception for above mentioned schemes is taken for the period December 2004 to January 2024 (Since SIP facility was introduced in November 2004. Past performance may or may not be sustained in future.
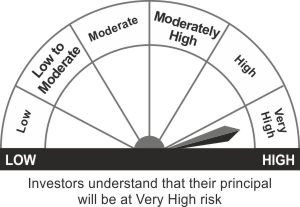
*Investors should consult their Mutual Fund Distributor if in doubt about whether the product is suitable for them.:
- Long term capital appreciation
- Investment in equity instruments (maximum-80%) and fixed income securities (debt and money market securities)
*Investors should consult their financial advisers if in doubt about whether the product is suitable for them.