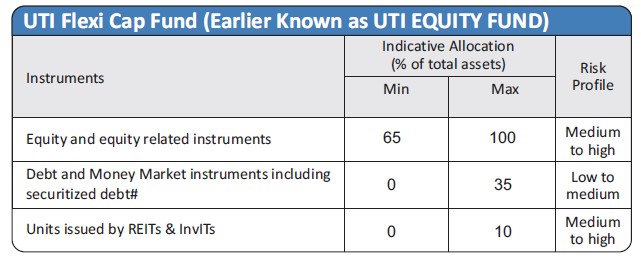
| Investment Objective The primary objective of the scheme is to generate long term capital appreciation by investing predominantly in equity and equity related securities of companies in a flexible manner across the market capitalization spectrum. However, there can be no assurance or guarantee that the investment objective of the scheme would be achieved. |
|||||||||||||
| Inception Date |
18th May, 1992 | ||||||||||||
| Fund Manager |
Ajay Tyagi - CFA, MFC Managing the scheme since Jan-2016 |
||||||||||||
| Fund AUM |
Fund size monthly average : 25666.54 Crore Closing AUM : 25156.40 Crore |
||||||||||||
| High/Low NAV in the month |
High Growth Option : 277.8692 Low Growth Option : 265.4072 |
||||||||||||
Total expense ratio (%) |
Regular : 1.64 Direct : 0.87 |
||||||||||||
Minimum Investment Amount |
Growth, IDCW: 5000/- | ||||||||||||
Plans/Options
(Regular / Direct) |
Growth option IDCW option with Payout and Reinvestment | ||||||||||||
| Market Capitalisation (%) |
|
||||||||||||
Load Structure |
Nil (A) Redemption / Switch out within 1 year from the date of allotment – (I) upto 10% of the allotted Units – NIL (ii) beyond 10% of the allotted Units - 1.00% (B) Redemption / Switch out after 1 year from the date of allotment – NIL |
||||||||||||
NAV per unit as on 31st January, 2024 |
Regular Growth Option 268.3625 Regular IDCW Option 177.4242 Direct Growth Option 285.0249 Direct IDCW Option 189.6795 |
||||||||||||
Benchmark Index |
Nifty 500 TRI | ||||||||||||
SIP/SWP/STRIP |
|||||||||||||
| Fund Size | 25666.54 Cr (Monthly Average as on 31/1/2024) | ||||||||||||
Overweight (Top 5) |
% of Nav |
Underweight (Top 5) |
% of Nav |
| LTIMindtree Ltd. | 5.25 |
Reliance Industries Ltd. | -6.16 |
| Bajaj Finance Ltd. | 4.07 |
Larsen And Toubro Ltd. | -2.62 |
| Avenue Supermarts Ltd. | 3.28 |
ITC Ltd. | -2.50 |
| Info-Edge (India) Ltd. | 3.02 |
Tata Consultancy Services Ltd. | -2.47 |
| Coforge Ltd | 2.83 |
Axis Bank Ltd. | -1.89 |
UTI Flexi Cap Fund (Earlier Known as UTI EQUITY FUND) - IDCW Declared |
||||||
Year |
IDCW |
Rs. Per unt |
NAV (Cum Div ) |
Face Value (per unit) |
NAV Date |
Record Date |
2000 |
15% |
1.50 |
13.14 |
10.00 |
N/A* |
02-04-2000 |
2004 |
30.00% |
3.00 |
19.69 |
10.00 |
23-01-2004 |
13-02-2004 |
2005 |
20.00% |
2.00 |
21.28 |
10.00 |
17-05-2005 |
09-06-2005 |
2006 |
20.00% |
2.00 |
26.99 |
10.00 |
12-07-2006 |
19-07-2006 |
2009 |
10% |
1.00 |
25.60 |
10.00 |
08-04-2009 |
16-04-2009 |
2013 |
14.00% |
1.40 |
54.87 |
10.00 |
19-02-2013 |
26-02-2013 |
2014 |
17.50% |
1.75 |
67.6094 |
10.00 |
20-05-2014 |
27-05-2014 |
2015 |
28.00% |
2.80 |
83.6487 |
10.00 |
13-05-2015 |
14-05-2015 |
2016 |
28.00% |
2.80 |
82.604 |
10.00 |
13-06-2016 |
20-06-2016 |
2017 |
28.00% |
2.80 |
93.6715 |
10.00 |
13-06-2017 |
20-06-2017 |
2018 |
33.00% |
3.30 |
112.6637 |
10.00 |
16-08-2018 |
23-08-2018 |
2019 |
30% |
3.00 |
99.2097 |
10.00 |
29-07-2019 |
05-08-2019 |
2020 |
30.00% |
3.00 |
109.9267 |
10.00 |
18-08-2020 |
25-08-2020 |
2021 |
45.00% |
4.50 |
171.6550 |
10.00 |
05-8-2021 |
12-08-2021 |
The scheme IDCW details under regular plan.
Disclaimer: Pursuant to payment of Dividend/Bonus, the Nav of the income distribution cum capital withdrawal options of the schemes would fall to the extent of payout and statutory levy (if applicable) * Not Available
| Financial Services | 23% |
| Information Technology | 14% |
| Consumer Services | 13% |
| Healthcare | 12% |
| Consumer Durables | 10% |
|
Equity
|
% of NAV
|
| ICICI Bank Ltd | 6.09 |
| HDFC Bank Ltd. | 5.73 |
| LTIMindtree Ltd. | 5.57 |
| Bajaj Finance Ltd. | 5.29 |
| Infosys Ltd. | 4.04 |
| Kotak Mahindra Bank Ltd. | 3.74 |
| Avenue Supermarts Ltd. | 3.65 |
| Info-Edge (India) Ltd. | 3.27 |
| Titan Company Ltd. | 3.21 |
| Coforge Ltd | 3.07 |
| Astral Ltd. | 2.58 |
| Maruti Suzuki India Ltd. | 1.97 |
| Asian Paints Ltd. | 1.64 |
| Ajanta Pharma Ltd. | 1.60 |
| Dr. Lal Pathlabs Ltd. | 1.57 |
| Shree Cement Ltd. | 1.54 |
| Bharti Airtel Ltd. | 1.49 |
| AU Small Finance Bank Ltd | 1.46 |
| Endurance Technologies Ltd. | 1.39 |
| Grindwell Norton Ltd. | 1.38 |
| Persistent Systems Ltd. | 1.38 |
| Trent Ltd. | 1.35 |
| Schaeffler India Ltd | 1.34 |
| Berger Paints India Ltd. | 1.33 |
| P I Industries Ltd. | 1.29 |
| Zomato Ltd | 1.27 |
| Suven Pharmaceuticals Ltd | 1.26 |
| Jubilant Food Works Ltd | 1.26 |
| Nestle India Ltd. | 1.25 |
| Poly Medicure Ltd. | 1.24 |
| Others | 22.43 |
| Net Current Assets | 4.33 |
TOTAL |
100.00 |
% of top 10 stocks |
43.66 |
Median Market Cap ( Cr) |
107,358 |
Weighted Average Market Cap |
262,188 |
Number of Securities |
56 |
All figures given are provisional and unaudited. |
Quantitative Indicators |
Fund |
Benchmark |
Beta |
0.90 |
1 |
Standard Deviation (Annual) |
13.82% |
14.36% |
Sharpe ratio |
0.32% |
|
| Portfolio Turnover Ratio (Annual) | 0.04 |
|
| P/B | 11.82 |
8.00 |
| P/E | 44.03 |
35.76 |
| RoE | 20.15 |
18.66 |
| Fund Performance Vs Benchmark (CAGR) as on 31st January, 2024 Growth of 10000 |
||||||
| Period | NAV Growth (%) |
Nifty 500 TRI (%) |
Nifty 50 TRI (%) |
NAV Growth () |
Nifty 500 TRI () |
Nifty 500 TRI () |
| 1 Y | 19.18 |
33.81 |
24.35 |
11,918 |
13,381 |
12,435 |
| 3 Y | 11.25 |
21.84 |
18.19 |
13,769 |
18,087 |
16,510 |
| 5 Y | 14.92 |
18.34 |
16.29 |
20,051 |
23,220 |
21,276 |
| SI* | 12.41 |
NA |
NA |
409,108 |
NA |
NA |
B - Benchmark, AB - Additional Benchmark,
TRI - Total Return Index
Past performance may or may not be sustained in future. Different plans shall have a different expense structure. The performance details provided herein are of regular plan (growth Option). Returns greater than 1 year period are Compound Annual Growth Rate (CAGR). Inception of UTI Flexi Cap Fund: May 18, 1992. Date of allotment in the scheme/plan has been considered for inception date. The Scheme is currently managed by Mr. Ajay Tyagi since Jan-2016. Period for which scheme's performance has been provided is computed basis last day of the month-end preceding the date of advertisement. In case, the start/end date of the concerned period is a non-business day, the NAV of the previous date is considered for computation of returns. When scheme/additional benchmark returns are not available, they have been shown as N/A.*Assuming all IDCWs were reinvested at the immediate ex-IDCW Option NAV. NAVs of IDCW Option for the period where growth Option was not available and NAVs of growth Option thereafter is considered. Please refer page no. 96 for FPI Performance. Load is not taken into consideration for computation of performance.
| Period | |||||||
|
Investment Amount ()
|
Value- Fund TRI ()
|
Nifty 500 TRI
() |
Nifty 50 TRI ()
|
Yield (%)
Fund |
Yield (%)
Nifty 500 TRI |
Yield (%)
Nifty 50 TRI |
|
1 Y |
120,000 |
131,775 |
146,215 |
138,471 |
18.62 |
42.69 |
29.62 |
3 Y |
360,000 |
403,960 |
488,320 |
459,553 |
7.62 |
20.82 |
16.50 |
5 Y |
600,000 |
848,844 |
1,027,778 |
947,510 |
13.84 |
21.66 |
18.32 |
7 Y |
840,000 |
1,354,927 |
1,600,452 |
1,496,823 |
13.41 |
18.08 |
16.20 |
10 Y |
1,200,000 |
2,377,245 |
2,807,351 |
2,594,881 |
13.11 |
16.21 |
14.74 |
15 Y |
1,800,000 |
5,621,600 |
6,165,452 |
5,566,777 |
13.93 |
15.00 |
13.82 |
SI* |
2,300,000 |
10,344,924 |
10,611,467 |
9,702,353 |
13.93 |
14.14 |
13.37 |
Note: Systematic Investment Plan (SIP) returns are worked out assuming investment of 10,000/- every month at NAV per unit of the scheme as on the first working day for the respective time periods. The loads have not been taken into account.*Since inception for above mentioned schemes is taken for the period December 2004 to January 2024 (Since SIP facility was introduced in November 2004. Past performance may or may not be sustained in future.
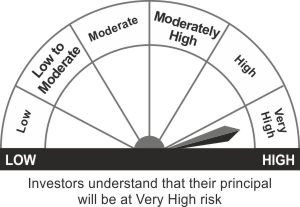
*Investors should consult their Mutual Fund Distributor if in doubt about whether the product is suitable for them.
- Long term capital appreciation
- Investment in equity instruments of companies with good growth prospects across the market capitalization spectrum
*Investors should consult their financial advisers if in doubt about whether the product is suitable for them.