| Investment Objective The objective of the scheme is to generate long term capital appreciation by investing predominantly in equity and equity related securities of large cap companies. However, there can be no assurance or guarantee that the investment objective of the scheme would be achieved. |
|||||||||||||
| Inception Date |
15th October, 1986 | ||||||||||||
| Fund Manager |
Mr. Karthikraj Lakshmanan , BCom, CA, PGDBM, CFA (CFAI, USA) Managing the scheme since Sep-2022 |
||||||||||||
| Fund AUM |
Fund size monthly average : 12086.38 Crore Closing AUM : 12081.66 Crore |
||||||||||||
High/Low NAV in the month |
High Growth Option : 237.7166 Low Growth Option : 229.9732 |
||||||||||||
Total expense ratio (%) |
Regular :1.73 Direct : 0.81 |
||||||||||||
Minimum Investment Amount |
Growth: 100/- IDCW: 5000/- |
||||||||||||
Plans/Options
(Regular / Direct) |
Growth option
IDCW option with Payout and Reinvestment Can Serve facility available |
||||||||||||
| Market Capitalisation (%) |
|
||||||||||||
Load Structure |
Entry Load : Nil Exit Load (A) Redemption / Switch out within 1 year from the date of allotment – (i) upto 10% of the allotted Units – NIL (ii) beyond 10% of the allotted Units - 1.00 % (B) Redemption / Switch out after 1 year from the date of allotment – NIL |
||||||||||||
NAV per unit as on 31st January, 2024 |
Regular Growth Option 233.5784 Regular IDCW Option 48.5886 Direct Growth Option 252.9147 Direct IDCW Option 56.2904 |
||||||||||||
Benchmark Index |
S&P BSE 100 TRI | ||||||||||||
SIP/SWP/STRIP |
|||||||||||||
| Fund Size | 12086.38 Cr (Monthly Average as on 31/1/2024) | ||||||||||||
Overweight (Top 5) |
% of Nav |
Underweight (Top 5) |
% of Nav |
| Infosys Ltd. | 3.56 |
ITC Ltd. | -3.35 |
| Avenue Supermarts Ltd. | 3.00 |
Larsen And Toubro Ltd. | -2.51 |
| ICICI Lombard General Insurance Company Ltd | 1.74 |
Reliance Industries Ltd. | -2.29 |
| LTIMindtree Ltd. | 1.60 |
State Bank Of India | -2.11 |
| Bharti Airtel Ltd. | 1.58 |
Hindustan Unilever Ltd. | -1.90 |
UTI Mastershare Unit Scheme - IDCW Declared |
||||||
Year |
IDCW |
Rs. Per unt |
NAV
(Cum Div ) |
Face Value (per unit) |
NAV Date |
Record Date |
1988 |
13.00% |
1.30 |
14.70 |
10.00 |
June 30, 1988 |
June 30, 1988 |
1989 |
17.78 |
10.00 |
January 10, 1989 |
January 10, 1989 |
||
18.00% |
1.80 |
29.45 |
10.00 |
June 30, 1989 |
June 30, 1989 |
|
1990 |
18.00% |
1.80 |
26.52 |
10.00 |
June 4, 1990 |
June 4, 1990 |
1991 |
18.00% |
1.80 |
36.00 |
10.00 |
June 28, 1991 |
June 28, 1991 |
1:2 bonus |
42.09 |
10.00 |
July 30, 1991 |
July 30, 1991 |
||
1992 |
18.00% |
1.80 |
50.00 |
10.00 |
June 24, 1992 |
June 24, 1992 |
1993 |
1:3 bonus |
0.80 |
32.10 |
10.00 |
December 13, 1993 |
December 13, 1993 |
1:1 right @15 |
10.00 |
December 20, 1993 |
December 20, 1993 |
|||
18.00% |
1.80 |
57.60 |
10.00 |
November 24, 1993 |
November 24, 1993 |
|
1994 |
20.00% |
2.00 |
37.97 |
10.00 |
July 27, 1994 |
July 27, 1994 |
1995 |
16.00% |
1.60 |
29.78 |
10.00 |
June 14, 1995 |
June 14, 1995 |
1:5 bonus |
23.09 |
10.00 |
August 30, 1995 |
August 30, 1995 |
||
1996 |
16.00% |
1.60 |
24.16 |
10.00 |
August 28, 1996 |
August 28, 1996 |
1997 |
16.00% |
1.60 |
24.76 |
10.00 |
August 20, 1997 |
August 20, 1997 |
1998 |
16.00% |
1.60 |
15.76 |
10.00 |
August 19, 1998 |
August 19, 1998 |
1999 |
16.00% |
1.60 |
22.62 |
10.00 |
August 25, 1999 |
August 25, 1999 |
2000 |
16.00% |
1.60 |
17.14 |
10.00 |
May 17, 2000 |
May 17, 2000 |
2001 |
10.00% |
1.00 |
10.34 |
10.00 |
October 3, 2001 |
October 3, 2001 |
2002 |
10.00% |
1.00 |
11.13 |
10.00 |
October 11, 2002 |
October 11, 2002 |
2003 |
14.00% |
1.40 |
14.54 |
10.00 |
September 18, 2003 |
September 18, 2003 |
2004 |
20.00% |
2.00 |
18.90 |
10.00 |
September 24, 2004 |
September 24, 2004 |
2005 |
25.00% |
2.50 |
23.47 |
10.00 |
October 20, 2005 |
October 20, 2005 |
2006 |
30.00% |
3.00 |
29.77 |
10.00 |
November 10, 2006 |
November 10, 2006 |
2007 |
35.00% |
3.50 |
42.75 |
10.00 |
November 7, 2007 |
November 7, 2007 |
2008 |
22.00% |
2.20 |
20.93 |
10.00 |
October 23, 2008 |
October 23, 2008 |
2009 |
27.00% |
2.70 |
28.65 |
10.00 |
October 30, 2009 |
October 30, 2009 |
2010 |
30.00% |
3.00 |
34.04 |
10.00 |
November 15, 2010 |
November 15, 2010 |
2011 |
22.00% |
2.20 |
28.02 |
10.00 |
October 31, 2011 |
October 31, 2011 |
2012 |
22.00% |
2.20 |
27.36 |
10.00 |
November 15, 2012 |
November 15, 2012 |
2013 |
22.50% |
2.25 |
27.33 |
10.00 |
October 29, 2013 |
October 29, 2013 |
2014 |
27.50% |
2.75 |
35.54 |
10.00 |
November 5, 2014 |
November 5, 2014 |
2015 |
28.00% |
2.80 |
33.76 |
10.00 |
November 9, 2015 |
November 16, 2015 |
2016 |
30.00% |
3.00 |
34.5821 |
10.00 |
November 01, 2016 |
November 08, 2016 |
2017 |
35.00% |
3.50 |
34.7809 |
10.00 |
October 09, 2017 |
October 16, 2017 |
2018 |
27.00% |
2.70 |
32.6933 |
10.00 |
November 05, 2018 |
November 15, 2018 |
2019 $ |
26.00% |
2.60 |
31.5608 |
10.00 |
October 10, 2019 |
October 17, 2019 |
2020 |
16.00% |
1.60 |
31.2494 |
10.00 |
October 29, 2020 |
November 05, 2020 |
2021 |
27.00% |
2.7 |
46.7047 |
10.00 |
25-10-2021 |
01-11-2021 |
2022 |
12.00% |
1.20 |
42.8204 |
10 |
27-10-2022 |
03-11-2022 |
The scheme IDCW details under regular plan.
Disclaimer: Pursuant to payment of Dividend/Bonus, the Nav of the income distribution cum capital withdrawal options of the schemes would fall to the extent of payout and statutory levy (if applicable)
| Financial Services | 30% |
| Information Technology | 16% |
| Automobile and Auto Components | 8% |
| Oil, Gas & Consumable Fuels | 7% |
| Consumer Services | 7% |
|
Equity
|
% of NAV
|
| Infosys Ltd. | 8.65 |
| HDFC Bank Ltd. | 8.23 |
| ICICI Bank Ltd | 7.45 |
| Reliance Industries Ltd. | 6.16 |
| Bharti Airtel Ltd. | 4.12 |
| Axis Bank Ltd. | 3.88 |
| Tata Consultancy Services Ltd. | 3.65 |
| Avenue Supermarts Ltd. | 3.48 |
| Kotak Mahindra Bank Ltd. | 3.06 |
| Bajaj Finance Ltd. | 2.96 |
| Ultratech Cement Ltd. | 2.52 |
| Maruti Suzuki India Ltd. | 2.35 |
| ICICI Lombard General Insurance Company Ltd | 2.04 |
| LTIMindtree Ltd | 2.03 |
| Tata Motors Ltd. | 1.96 |
| Godrej Consumer Products Ltd | 1.64 |
| Sun Pharmaceuticals Industries Ltd. | 1.62 |
| Tata Steel Ltd. | 1.57 |
| NTPC Ltd. | 1.44 |
| Info-Edge (India) Ltd. | 1.42 |
| Asian Paints Ltd. | 1.38 |
| United Breweries Ltd. | 1.37 |
| IndusInd Bank Ltd. | 1.34 |
| Coal India Ltd. | 1.31 |
| HDFC Life Insurance Company Ltd. | 1.29 |
| Bajaj Auto Ltd. | 1.24 |
| Havells India Ltd. | 1.21 |
| Larsen And Toubro Ltd. | 1.10 |
| Balkrishna Industries Ltd. | 1.08 |
| Interglobe Aviation Ltd | 1.05 |
| Others | 14.23 |
| Net Current Assets | 3.17 |
TOTAL |
100.00 |
% of top 10 stocks |
51.63 |
Median Market Cap ( Cr) |
336,135 |
Weighted Average Market Cap |
536,487 |
Number of Securities |
50 |
All figures given are provisional and unaudited. |
Quantitative Indicators |
Fund |
Benchmark |
Beta |
0.94 |
1 |
Standard Deviation (Annual) |
13.77% |
14.43% |
Sharpe ratio |
0.67% |
|
| Portfolio Turnover Ratio (Annual) | 0.22 |
|
| P/B | 7.44 |
7.57 |
| P/E | 36.02 |
33.63 |
| RoE | 18.25 |
19.00 |
| Fund Performance Vs Benchmark (CAGR) as on 31st January, 2024 Growth of 10000
|
Period | NAV Growth (%) |
S&P BSE 100 TRI (%) |
S&P BSE Sensex TRI (%) |
NAV Growth () |
S&P BSE 100 TRI () |
S&P BSE Sensex TRI () |
| 1 Y | 23.18 |
27.28 |
22.10 |
12,318 |
12,728 |
12,210 |
| 3 Y | 16.12 |
19.32 |
17.15 |
15,657 |
16,988 |
16,078 |
| 5 Y | 15.10 |
16.81 |
16.00 |
20,209 |
21,756 |
21,012 |
| SI* | 15.60 |
NA |
15.03 |
2,236,752 |
NA |
1,857,791 |
B - Benchmark, AB - Additional Benchmark, TRI - Total Return Index
Past performance may or may not be sustained in future. Different plans shall have a different expense structure. The performance details provided herein are of regular plan (growth option). Returns greater than 1 year period are Compound Annual Growth Rate (CAGR). Inception of UTI Mastershare Unit Scheme - October 15, 1986. Date of allotment in the scheme/plan has been considered for inception date. The Scheme is currently managed by Mr. Karthikraj Lakshmanan since Sep 2022. Period for which scheme's performance has been provided is computed basis last day of the month-end preceding the date of advertisement. In case, the start/end date of the concerned period is a non-business day, the NAV of the previous date is considered for computation of returns.*Assuming all IDCWs were reinvested at the immediate ex-IDCW NAV, all bonuses were availed and all right offers were availed, if any. NAVs of IDCW option for the period where growth option was not available and NAVs of growth option thereafter is considered. As TRI values are not available since inception of the scheme, benchmark performance is calculated using composite CAGR of S&P Sensex PRI values from 15-10-1986 to 31-12-1990 and S&P BSE 100 TRI values thereafter. Load is not taken into consideration for computation of performance.
| Period | |||||||
|
Investment Amount ()
|
Value- Fund
() |
S&P BSE
100 TRI () |
S&PBSE
Sensex TRI () |
Yield (%) Fund
|
Yield (%) S&P BSE
100 TRI |
Yield (%) S&PBSE
Sensex TRI |
|
1 Y |
120,000 |
137,063 |
140,732 |
135,829 |
27.28 |
33.40 |
25.25 |
3 Y |
360,000 |
442,173 |
469,154 |
452,633 |
13.81 |
17.96 |
15.44 |
5 Y |
600,000 |
907,316 |
972,840 |
930,004 |
16.55 |
19.40 |
17.56 |
7 Y |
840,000 |
1,411,079 |
1,527,046 |
1,486,493 |
14.55 |
16.77 |
16.01 |
10 Y |
1,200,000 |
2,414,780 |
2,659,985 |
2,587,135 |
13.40 |
15.20 |
14.69 |
15 Y |
1,800,000 |
5,277,942 |
5,791,501 |
5,592,831 |
13.20 |
14.27 |
13.87 |
SI* |
2,300,000 |
9,158,111 |
10,111,212 |
9,803,905 |
12.87 |
13.73 |
13.46 |
Note: Systematic Investment Plan (SIP) returns are worked out assuming investment of ₹ 10,000/- every month at NAV per unit of the scheme as on the first working day for the respective time periods. The loads have not been taken into account.*Since inception for the above mentioned schemes is taken for the period December 2004 to January 2024 (Since SIP facility was introduced in November 2004. Past performance may or may not be sustained in future.
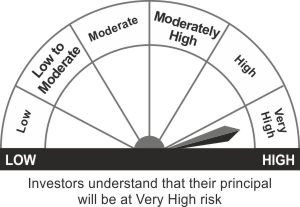
*Investors should consult their Mutual Fund Distributor if in doubt about whether the product is suitable for them.
- Long term capital appreciation
- Investment predominantly in equity instruments of large cap companies
*Investors should consult their financial advisers if in doubt about whether the product is suitable for them.