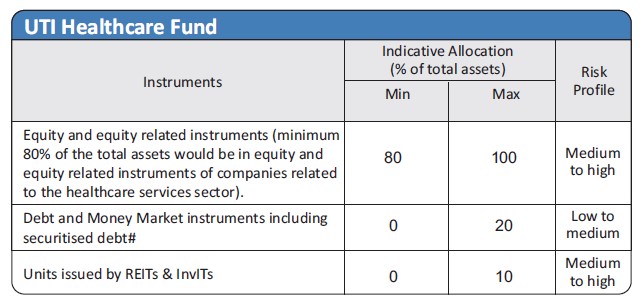
| Investment Objective The primary objective of the scheme is to generate long term capital appreciation by investing predominantly in equity and equity related securities of companies/institutions engaged in the Healthcare Services Sector. However, there can be no assurance or guarantee that the investment objective of the scheme would be achieved. |
|||||||||||||
| Inception Date |
28th June, 1999 | ||||||||||||
| Fund Manager |
Mr. Kamal Gada B.Com, CA, CS,CFA Managing the scheme since May 2022 | ||||||||||||
| Fund AUM |
Fund size monthly average :897.00 Crore Closing AUM : 919.33 Crore |
||||||||||||
| High/Low NAV in the month |
High Growth Option : 216.4524 Low Growth Option : 206.6201 |
||||||||||||
Total expense ratio (%) |
Regular : 2.32 Direct : 1.34 |
||||||||||||
Minimum Investment Amount |
Growth, IDCW: 5,000/- | ||||||||||||
Plans/Options
(Regular / Direct) |
Growth option IDCW option with Payout and Reinvestment | ||||||||||||
| Market Capitalisation (%) |
|
||||||||||||
Load Structure |
Entry Load : Nil Exit Load : < 30 days – 1%;≥ 30 days – Nil |
||||||||||||
NAV per unit as on 31st January, 2024 |
Regular Growth Option 216.4524 Regular IDCW Option 167.2874 Direct Growth Option 240.5564 Direct IDCW Option 185.9341 |
||||||||||||
Benchmark Index |
S&P BSE Healthcare TRI | ||||||||||||
SIP/SWP/STRIP |
|||||||||||||
| Fund Size | 897.00 Crore (Monthly Average as on 31/1/2024) | ||||||||||||
Overweight (Top 5) |
% of Nav |
Underweight (Top 5) |
% of Nav |
| Ajanta Pharma Ltd. | 4.02 |
Max Healthcare Institute Ltd | -6.07 |
| Krishna Institute Of Medical Science Ltd | 2.65 |
Lupin Ltd. | -3.82 |
| Eris Lifesciences Ltd | 2.61 |
Sun Pharmaceuticals Industries Ltd. | -3.16 |
| Suven Pharmaceuticals Ltd | 2.50 |
Divis Laboratories Ltd. | -2.32 |
| Metropolis Healthcare Ltd | 1.94 |
Laurus Labs Ltd. | -1.58 |
UTI Healthcare Fund (Formerly known as UTI Pharma & Healthcare Fund) IDCW Declared |
||||||
Year |
IDCW |
Per unt |
NAV (Cum Div ) |
Face Value (per unit) |
NAV Date |
Record Date |
2006 |
25% |
2.50 |
21.34 |
10.00 |
10-01-2006 |
17-01-2006 |
2008 |
15% |
1.50 |
20.91 |
10.00 |
26-08-2008 |
02-09-2008 |
2010 |
17% |
1.70 |
32.65 |
10.00 |
28-10-2010 |
04-11-2010 |
The scheme IDCW details under regular plan.
Disclaimer:Pursuant to payment of Dividend/Bonus, the Nav of the income distribution cum capital withdrawal options of the schemes would fall to the extent of payout and statutory levy (if applicable)
| Healthcare | 98% |
| Financial Services | 1% |
|
Equity
|
% of NAV
|
| Sun Pharmaceuticals Industries Ltd. | 12.96 |
| Cipla Ltd. | 7.35 |
| Apollo Hospitals Enterprise Ltd. | 7.12 |
| Dr Reddy's Laboratories Ltd. | 6.57 |
| Ajanta Pharma Ltd. | 4.97 |
| Aurobindo Pharma Ltd. | 4.76 |
| Fortis Healthcare Ltd. | 3.99 |
| Krishna Institute Of Medical Science Ltd | 3.75 |
| Torrent Pharmaceuticals Ltd. | 3.31 |
| Suven Pharmaceuticals Ltd | 3.22 |
| Eris Lifesciences Ltd | 2.99 |
| IPCA Laboratories Ltd. | 2.69 |
| Gland Pharma Ltd | 2.65 |
| Zydus Lifesciences Ltd | 2.63 |
| Divis Laboratories Ltd. | 2.60 |
| Metropolis Healthcare Ltd | 2.38 |
| Alkem Laboratories Ltd | 2.11 |
| Proctor & Gamble Health Ltd | 1.95 |
| Concord Biotech Ltd | 1.80 |
| Syngene International Ltd. | 1.74 |
| Jupiter Life Line Hospitals Ltd | 1.55 |
| Pfizer Ltd. | 1.51 |
| Ami Organics Ltd | 1.39 |
| Alembic Pharmaceuticals Ltd. | 1.25 |
| Marksans Pharma Ltd. | 1.18 |
| Windlas Biotec Ltd | 1.15 |
| Abbott India Ltd. | 1.13 |
| Rainbow Childrens Medicare Ltd | 1.06 |
| Poly Medicure Ltd. | 0.99 |
| Mankind Pharma Ltd | 0.96 |
| Others | 4.63 |
| Net Current Assets | 1.66 |
TOTAL |
100.00 |
% of top 10 stocks |
57.99 |
Median Market Cap ( Cr) |
64,028
|
Weighted Average Market Cap |
88,736 |
Number of Securities |
36 |
All figures given are provisional and unaudited. |
Quantitative Indicators |
Fund |
Benchmark |
Beta |
0.87 |
1 |
Standard Deviation (Annual) |
12.68% |
14.00% |
Sharpe ratio |
0.78 |
|
| Portfolio Turnover Ratio (Annual) | 0.18 |
|
| P/B | 7.32 |
7.34 |
| P/E | 45.21 |
46.01 |
| RoE | 15.80 |
14.47 |
| Fund Performance Vs Benchmark (CAGR) as on 31st January, 2024 Growth of 10000 |
||||||
| Period | NAV Growth (%) |
S&P BSE Healthcare TRI (%) |
Nifty 50 TRI (%) |
NAV Growth () |
S&P BSE Healthcare TRI () |
Nifty 50 TRI () |
| 1 Y | 48.93 |
51.45 |
24.35 |
14,893 |
15,145 |
12,435 |
| 3 Y | 16.79 |
18.69 |
18.19 |
15,930 |
16,720 |
16,510 |
| 5 Y | 20.82 |
20.31 |
16.29 |
25,758 |
25,219 |
21,276 |
| SI* | 14.60 |
14.94 |
NA |
286,149 |
307,791 |
NA |
B - Benchmark, AB - Additional Benchmark, TRI - Total Return Index;
Past performance may or may not be sustained in the future. Different plans shall have different expense structures. The performance details provided herein are of regular plan (growth option). Returns greater than 1 year period are Compound Annual Growth Rate (CAGR). *Inception Date of UTI Healthcare Fund: June 28, 1999. @Since Inception return for SIP – Aug 1, 2007.
For SIP calculation monthly investment of ₹ 10000 is taken. The Scheme is currently managed by Mr Kamal Gada since Apr 2023. Period for which scheme's performance has been provided is computed basis last day of the month-end preceding the date of advertisement. Load is not taken into consideration for computation of performance.
| Period | |||||||
|
Investment Amount ()
|
Value- Fund
() |
S&P BSE
Healthcare TRI () |
Nifty 50 TRI ()
|
Yield (%) Fund
|
Yield (%)
S&P BSE Healthcare TRI |
Yield (%)
Nifty 50 TRI |
|
1 Y |
120,000 |
156,379 |
159,081 |
138,471 |
60.37 |
65.16 |
29.62 |
3 Y |
360,000 |
494,307 |
504,890 |
459,553 |
21.69 |
23.23 |
16.50 |
5 Y |
600,000 |
1,051,902 |
1,068,469 |
947,510 |
22.62 |
23.27 |
18.32 |
7 Y |
840,000 |
1,657,439 |
1,660,164 |
1,496,823 |
19.07 |
19.11 |
16.20 |
10 Y |
1,200,000 |
2,588,370 |
2,542,600 |
2,594,881 |
14.69 |
14.36 |
14.74 |
15 Y |
1,800,000 |
6,258,292 |
6,418,119 |
5,566,777 |
15.17 |
15.46 |
13.82 |
SI* |
2,300,000 |
11,603,387 |
12,091,914 |
9,702,353 |
14.91 |
15.26 |
13.37 |
Note: Systematic Investment Plan (SIP) returns are worked out assuming investment of 10,000/- every month at NAV per unit of the scheme as on the first working day for the respective time periods. The loads have not been taken into account.*Since inception for above mentioned schemes is taken for the period December 2004 to January 2024 (Since SIP facility was introduced in November 2004. Past performance may or may not be sustained in future.
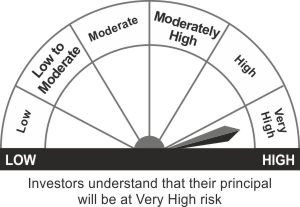
*Investors should consult their Mutual Fund Distributor if in doubt about whether the product is suitable for them.
- Long term capital appreciation
- Investment predominantly in equity and equity related securities in the Healthcare Services Sector
*Investors should consult their financial advisers if in doubt about whether the product is suitable for them.