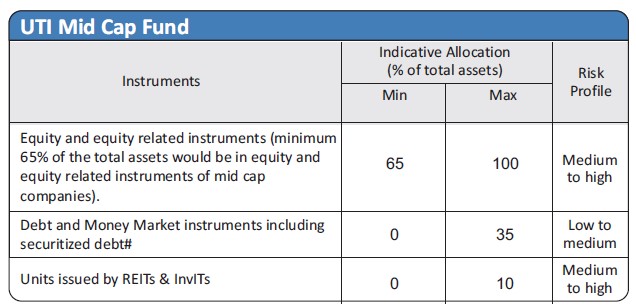
| Investment Objective The objective of the scheme is to generate long term capital appreciation by investing predominantly in equity and equity related securities of mid cap companies. However, there can be no assurance or guarantee that the investment objective of the scheme would be achieved. |
|||||||||||||
| Inception Date |
7th April, 2004 | ||||||||||||
| Fund Manager |
Mr Ankit Agarwal, B.Tech, PGDM Managing the scheme since Aug-2019 |
||||||||||||
| Fund AUM |
Fund size monthly average : 9881.64 Crore Closing AUM : 10072.11 Crore |
||||||||||||
| High/Low NAV in the month |
High Growth Option : 253.8930 Low Growth Option : 245.9019 |
||||||||||||
Total expense ratio (%) |
Regular : 1.74 Direct : 0.79 |
||||||||||||
Minimum Investment Amount |
Growth, IDCW: 5,000/- | ||||||||||||
Plans/Options
(Regular / Direct) |
Growth option IDCW option with Payout and Reinvestment | ||||||||||||
| Market Capitalisation (%) |
|
||||||||||||
Load Structure |
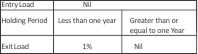 |
||||||||||||
NAV per unit as on 31st January, 2024 |
Regular Growth Option 253.8930 Regular IDCW Option 120.1445 Direct Growth Option 279.1951 Direct IDCW Option 137.3927 |
||||||||||||
Benchmark Index |
Nifty Midcap 150 TRI | ||||||||||||
SIP/SWP/STRIP |
|||||||||||||
| Fund Size | 9881.64 Crore (Monthly Average as on 31/1/2024) | ||||||||||||
Overweight (Top 5) |
% of NAV |
Underweight (Top 5) |
% of NAV |
| Bharat Electronics Ltd. | 2.12 |
Power Finance Corporation Ltd. | -2.36 |
| Shriram Finance Ltd | 2.08 |
REC Ltd | -2.27 |
| Endurance Technologies Ltd. | 1.49 |
Max Healthcare Institute Ltd | -2.12 |
| J.K.Cement Ltd. | 1.36 |
Adani Power Ltd. | -1.99 |
| Phoenix Mills Ltd | 1.30 |
Indian Hotels Company Ltd. | -1.59 |
UTI Mid Cap Fund - IDCW Declared |
||||||
Year |
IDCW |
Per unt |
NAV (Cum Div ) |
Face Value (per unit) |
NAV Date |
Record Date |
2006 |
30% |
3.00 |
19.43 |
10.00 |
18-08-2006 |
25-08-2006 |
2009 |
20% |
2.00 |
16.24 |
10.00 |
15-06-2009 |
23-06-2009 |
2010 |
22% |
2.20 |
26.03 |
10.00 |
14-09-2010 |
21-09-2010 |
2014 |
40% |
4.00 |
49.7962 |
10.00 |
26-11-2014 |
03-12-2014 |
2015 |
45% |
4.50 |
50.5602 |
10.00 |
02-12-2015 |
09-12-2015 |
2017 |
25% |
2.50 |
52.0223 |
10.00 |
20-02-2017 |
27-02-2017 |
2018 |
50% |
5.00 |
63.2793 |
10.00 |
18-01-2018 |
25-01-2018 |
2021 |
40% |
4.00 |
74.1048 |
10.00 |
08/03/2021 |
15/03/2021 |
The scheme IDCW details under regular plan.
Disclaimer: Pursuant to payment of Dividend/Bonus, the Nav of the income distribution cum capital withdrawal options of the schemes would fall to the extent of payout and statutory levy (if applicable)
|
Equity
|
% of NAV
|
| Tube Investments Of India Ltd | 2.46 |
| Bharat Forge Ltd. | 2.24 |
| Federal Bank Ltd. | 2.21 |
| Persistent Systems Ltd. | 2.20 |
| Coforge Ltd | 2.18 |
| Phoenix Mills Ltd | 2.13 |
| Bharat Electronics Ltd. | 2.12 |
| Shriram Finance Ltd | 2.08 |
| J.K.Cement Ltd. | 2.03 |
| Alkem Laboratories Ltd | 1.96 |
| Endurance Technologies Ltd. | 1.76 |
| PB Fintech Ltd | 1.76 |
| Oil India Ltd. | 1.75 |
| Astral Ltd. | 1.74 |
| Indian Bank | 1.68 |
| Syngene International Ltd. | 1.62 |
| Oracle Financial Services Software Ltd. | 1.60 |
| Ashok Leyland Ltd. | 1.49 |
| NHPC Ltd. | 1.48 |
| Gujarat Gas Ltd | 1.47 |
| Grindwell Norton Ltd. | 1.46 |
| Schaeffler India Ltd | 1.45 |
| Jubilant Food Works Ltd | 1.36 |
| Motherson Sumi Wiring India Ltd | 1.36 |
| Supreme Industries Ltd. | 1.34 |
| Page Industries Ltd | 1.34 |
| Sundram Fasteners Ltd. | 1.34 |
| Dr. Lal Pathlabs Ltd. | 1.32 |
| Balkrishna Industries Ltd. | 1.29 |
| One 97 Communications Ltd | 1.29 |
| Others | 44.94 |
| Net Current Assets | 3.57 |
TOTAL |
100.00 |
% of top 10 stocks |
21.61 |
Median Market Cap ( Cr) |
41,060
|
Weighted Average Market Cap |
45,352
|
Number of Securities |
83 |
All figures given are provisional and unaudited. |
Quantitative Indicators |
Fund |
Benchmark |
Beta |
0.87 |
1 |
Standard Deviation (Annual) |
14.48% |
16.05% |
Sharpe ratio |
1.20% |
|
| Portfolio Turnover Ratio (Annual) | 0.32 |
|
P/B |
8.87 |
8.52 |
P/E |
46.55 |
44.24 |
RoE |
17.10 |
17.58 |
| Financial Services | 21% |
| Capital Goods | 15% |
| Automobile and Auto Components | 12% |
| Healthcare | 10% |
| Information Technology | 9% |
| Fund Performance Vs Benchmark (CAGR) as on 31st January, 2024 Growth of 10000 |
||||||
| Period | NAV Growth (%) |
Nifty Midcap 150 TRI (%) |
Nifty 50 TRI (%) |
NAV Growth () |
Nifty Midcap 150 TRI () |
Nifty 50 TRI () |
| 1 Y | 37.09 |
55.19 |
24.35 |
13,709 |
15,519 |
12,435 |
| 3 Y | 24.24 |
32.49 |
18.19 |
19,177 |
23,257 |
16,510 |
| 5 Y | 21.63 |
25.29 |
16.29 |
26,634 |
30,892 |
21,276 |
| SI* | 18.26 |
NA |
14.69 |
278,216 |
NA |
151,495 |
B - Benchmark, AB - Additional Benchmark, TRI - Total Return Index
Past performance may or may not be sustained in future. Different plans shall have a different expense structure. The performance details provided herein are of regular plan (growth option). Returns greater than 1 year period are Compound Annual Growth Rate (CAGR). Inception of UTI Mid Cap Fund : April 07th, 2004. Date of allotment in the scheme/plan has been considered for inception date. The Scheme is currently managed by Mr. Ankit Agarwal since Aug 2019. Period for which scheme's performance has been provided is computed basis last day of the month-end preceding the date of advertisement. In case, the start/end date of the concerned period is a non-business day, the NAV of the previous date is considered for computation of returns. When scheme/additional benchmark returns are not available, they have been shown as N/A. Load is not taken into consideration for computation of performance.
| Period | |||||||
|
Investment Amount ()
|
Value- Fund
() |
Nifty Midcap
150 TRI () |
Nifty
50 TRI()
|
Yield (%) Fund
|
Yield (%)
Nifty Midcap 150 TRI |
Yield (%)
Nifty 50 TRI |
|
1 Y |
120,000 |
146,499 |
159,872 |
138,471 |
43.17 |
66.58 |
29.62 |
3 Y |
360,000 |
497,034 |
568,722 |
459,553 |
22.09 |
32.05 |
16.50 |
5 Y |
600,000 |
1,117,075 |
1,300,906 |
947,510 |
25.12 |
31.54 |
18.32 |
7 Y |
840,000 |
1,706,911 |
2,014,950 |
1,496,823 |
19.89 |
24.57 |
16.20 |
10 Y |
1,200,000 |
3,012,913 |
3,758,223 |
2,594,881 |
17.52 |
21.61 |
14.74 |
15 Y |
1,800,000 |
8,559,966 |
9,525,870 |
5,566,777 |
18.74 |
19.95 |
13.82 |
SI* |
2,300,000 |
15,273,023 |
15,960,136 |
9,702,353 |
17.24 |
18.10 |
13.37 |
Note: Systematic Investment Plan (SIP) returns are worked out assuming investment of 10,000/- every month at NAV per unit of the scheme as on the first working day for the respective time periods. The loads have not been taken into account.*Since inception for above mentioned schemes is taken for the period December 2004 to January 2024 (Since SIP facility was introduced in November 2004. Past performance may or may not be sustained in future.
*Investors should consult their Mutual Fund Distributor if in doubt about whether the product is suitable for them.
- Long term capital appreciation
- Investment predominantly in mid cap companies
*Investors should consult their financial advisers if in doubt about whether the product is suitable for them.