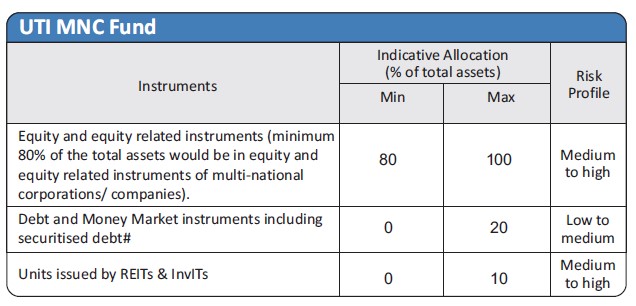
| Investment Objective The primary objective of the scheme is to generate long term capital appreciation by investing predominantly in equity and equity related securities of multinational companies. However, there can be no assurance or guarantee that the investment objective of the scheme would be achieved. |
|||||||||||||
| Inception Date |
29th May, 1998 | ||||||||||||
| Fund Manager |
Mr. Karthikraj Lakshmanan , BCom, CA, PGDBM, CFA (CFAI, USA) Managing the scheme since Nov - 2022 | ||||||||||||
| Fund AUM |
Fund size monthly average : 2723.79 Crore Closing AUM : 2726.73 Crore |
||||||||||||
| High/Low NAV in the month |
High Growth Option : 338.8634 Low Growth Option : 330.9792 |
||||||||||||
Total expense ratio (%) |
Regular : 2.02 Direct : 1.15 |
||||||||||||
Minimum Investment Amount |
Growth, IDCW: 5000/- | ||||||||||||
Plans/Options
(Regular / Direct) |
Growth option IDCW option with Payout and Reinvestment | ||||||||||||
| Market Capitalisation (%) |
|
||||||||||||
Load Structure |
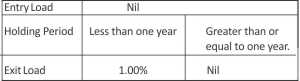 |
||||||||||||
NAV per unit as on 31st January, 2024 |
Regular Growth Option 337.1818 Regular IDCW Option 173.8458 Direct Growth Option 370.9535 Direct IDCW Option 192.4258 |
||||||||||||
Benchmark Index |
NIFTY MNC TRI | ||||||||||||
SIP/SWP/STRIP |
|||||||||||||
| Fund Size | 2723.79 Crore (Monthly Average as on 31/1/2024) | ||||||||||||
Overweight (Top 5) |
% of Nav |
Underweight (Top 5) |
% of Nav |
| ICICI Prudential Life Insurance Company Ltd. | 3.41 |
Hindustan Unilever Ltd. | -5.91 |
| Proctor & Gamble Health Ltd | 3.29 |
Ambuja Cements Ltd. | -5.39 |
| United Breweries Ltd. | 3.10 |
Vedanta Ltd | -4.80 |
| Bayer Cropscience Ltd. | 2.64 |
Colgate Palmolive India Ltd. | -4.48 |
| Suven Pharmaceuticals Ltd | 2.64 |
Ashok Leyland Ltd. | -3.31 |
UTI MNC Fund - IDCW Declared |
||||||
Year |
IDCW |
Per unt |
NAV (Cum Div ) |
Face Value (per unit) |
NAV Date |
Record Date |
2005 |
50% |
5.00 |
29.43 |
10.00 |
12-12-2005 |
19-12-2005 |
2007 |
30% |
3.00 |
30.54 |
10.00 |
25-05-2007 |
01-06-2007 |
2008 |
25% |
2.50 |
24.34 |
10.00 |
28-07-2008 |
04-08-2008 |
2010 |
15% |
1.50 |
37.68 |
10.00 |
31-08-2010 |
07-09-2010 |
2012 |
22% |
2.20 |
44.55 |
10.00 |
26-09-2012 |
03-10-2012 |
2014 |
25% |
2.50 |
80.13 |
10.00 |
18-11-2014 |
25-11-2014 |
2015 |
35% |
3.50 |
91.8144 |
10.00 |
19-10-2015 |
26-10-2015 |
2016 |
35% |
3.50 |
91.4860 |
10.00 |
13-10-2016 |
20-10-2016 |
2017 |
36% |
3.60 |
105.5565 |
10.00 |
29-11-2017 |
06-12-2017 |
2020 |
35% |
3.50 |
106.5713 |
10.00 |
30-01-2020 |
06-02-2020 |
The scheme IDCW details under regular plan.
Disclaimer: Pursuant to payment of Dividend/Bonus, the Nav of the income distribution cum capital withdrawal options of the schemes would fall to the extent of payout and statutory levy (if applicable)
| Fast Moving Consumer Goods | 28% |
| Healthcare | 16% |
| Automobile and Auto Components | 14% |
| Financial Services | 11% |
| Capital Goods | 10% |
|
Equity
|
% of NAV
|
| Maruti Suzuki India Ltd. | 7.47 |
| Nestle India Ltd. | 6.43 |
| United Spirits Ltd. | 5.20 |
| United Breweries Ltd. | 4.85 |
| Britannia Industries Ltd. | 4.80 |
| Oracle Financial Services Software Ltd. | 4.55 |
| Hindustan Unilever Ltd. | 3.46 |
| ICICI Prudential Life Insurance Company Ltd. | 3.41 |
| Abbott India Ltd. | 3.40 |
| Proctor & Gamble Health Ltd | 3.29 |
| Bosch Ltd. | 3.11 |
| Bayer Cropscience Ltd. | 2.64 |
| Suven Pharmaceuticals Ltd | 2.64 |
| 3M India Ltd. | 2.62 |
| Whirlpool Of India Ltd. | 2.45 |
| Schaeffler India Ltd | 2.43 |
| Timken India Ltd. | 2.31 |
| Siemens India Ltd. | 2.28 |
| CRISIL Ltd | 2.22 |
| Gland Pharma Ltd | 2.22 |
| Pfizer Ltd. | 1.98 |
| Coforge Ltd | 1.95 |
| Gillette India Ltd. | 1.93 |
| Biocon Ltd. | 1.87 |
| SKF India Ltd. | 1.82 |
| Nippon Life India Asset Management Ltd | 1.56 |
| CSB Bank Ltd | 1.40 |
| Cummins India Ltd. | 1.35 |
| HDFC Asset Management Company Ltd | 1.20 |
| Mphasis Ltd | 1.19 |
| Others | 6.71 |
| Net Current Assets | 5.26 |
TOTAL |
100.00 |
% of top 10 stocks |
46.87 |
Median Market Cap ( Cr) |
55,062 |
Weighted Average Market Cap |
103,521 |
Number of Securities |
39 |
All figures given are provisional and unaudited. |
Quantitative Indicators |
Fund |
Benchmark |
Beta |
0.86 |
1 |
Standard Deviation (Annual) |
11.70% |
12.78% |
Sharpe ratio |
0.74% |
|
| Portfolio Turnover Ratio (Annual) | 0.26 |
|
| P/B | 18.40 |
23.20 |
| P/E | 52.60 |
54.44 |
| RoE | 29.27 |
34.30 |
| Fund Performance Vs Benchmark (CAGR) as on 31st January, 2024 Growth of 10000 |
||||||
| Period | NAV Growth (%) |
Nifty MNC TRI (%) |
Nifty 50 TRI (%) |
NAV Growth TRI () |
Nifty MNC TRI () |
Nifty 50 TRI () |
| 1 Y | 25.27 |
26.77 |
24.35 |
12,527 |
12,677 |
12,435 |
| 3 Y | 15.54 |
17.67 |
18.19 |
15,424 |
16,293 |
16,510 |
| 5 Y | 11.57 |
14.30 |
16.29 |
17,293 |
19,516 |
21,276 |
| SI* | 15.85 |
13.67 |
NA |
438,222 |
268,980 |
NA |
Different plans have a different expense structure. The performance details provided herein are of regular plan.
*Compounded annualized Growth Rate.
For performance details of other Schemes managed by the Fund Manager, please refer the respective Scheme sheets as listed Please click here in ‘Fund Manager Summary’. N.A Not
Available. Schemes Managed by Mr. Karthikraj Lakshmanan.
The performance of the benchmark is calculated using total return index variant of the benchmark index. Load is not taken into consideration for computation of performance.
| Period | |||||||
|
Investment Amount ()
|
Value- Fund
() |
Nifty MNC TRI
( )
|
Nifty 50 TRI ()
|
Yield (%)
Fund |
Yield (%)
Nifty MNC TRI |
Yield (%)
Nifty 50 TRI |
|
1 Y |
120,000 |
138,872 |
140,508 |
140,519 |
30.74 |
33.52 |
33.54 |
3 Y |
360,000 |
450,591 |
470,180 |
465,536 |
15.19 |
18.20 |
17.49 |
5 Y |
600,000 |
869,774 |
934,189 |
958,475 |
14.87 |
17.79 |
18.84 |
7 Y |
840,000 |
1,309,208 |
1,423,093 |
1,515,511 |
12.48 |
14.82 |
16.58 |
10 Y |
1,200,000 |
2,257,866 |
2,564,707 |
2,623,360 |
12.16 |
14.54 |
14.96 |
15 Y |
1,800,000 |
6,035,915 |
6,346,194 |
5,641,474 |
14.76 |
15.34 |
13.98 |
SI* |
2,290,000 |
11,464,721 |
11,775,386 |
9,690,638 |
14.92 |
15.15 |
13.47 |
Note: Systematic Investment Plan (SIP) returns are worked out assuming investment of 10,000/- every month at NAV per unit of the scheme as on the first working day for the respective time periods. The loads have not been taken into account.*Since inception for above mentioned schemes is taken for the period December 2004 to January 2024 (Since SIP facility was introduced in November 2004. Past performance may or may not be sustained in future.
*Investors should consult their Mutual Fund Distributor if in doubt about whether the product is suitable for them.:
- Long term capital appreciation
- Investment predominantly in equity and equity related securities of Multi-National companies
*Investors should consult their financial advisers if in doubt about whether the product is suitable for them.