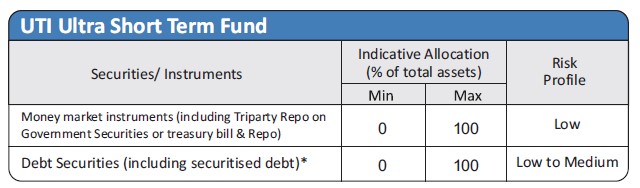
| Investment Objective The investment objective of the scheme is to generate reasonable income with low volatility through investment in a portfolio comprising of debt & money market instruments. However there can be no assurance that the investment objective of the Scheme will be achieved. The Scheme does not guarantee / indicate any returns. |
|
| Inception Date |
29th August, 2003 |
| Fund Manager |
Mr. Ritesh Nambiar [BMS (Fin), CFA, FRM, MMS (Finance)] Managing the scheme since Jul 2015 |
| Fund AUM |
Fund size monthly average : 1849.85 Crore Closing AUM : 1815.34 Crore |
| High/Low NAV in the month |
High Growth Option : 3837.8319 Low Growth Option : 3817.7303 |
Total expense ratio (%) |
Regular : 0.97 Direct : 0.44 |
Minimum Investment Amount |
Minimum initial investment under Growth option is Rs.500/- and in multiples of Re. 1/-.& under IDCW option is Rs.20,000/- and in multiples of Re.1/- |
Plans/Options
(Regular / Direct) |
Growth Option Daily IDCW /Weekly IDCW /Flexi IDCW Option Fortnightly/Monthly/Quarterly/Half Yearly/Annual Payout & Reinvestment IDCW Option |
| Portfolio Parameters | Weighted Average Maturity : 146 Days Yield to Maturity* : 8.02% Modified Duration : 140 Days Macualay Duration : 144 Days *Annualized Portfolio YTM – Yields of all securities are annualized |
Load Structure |
Entry Load : Nil Exit Load : Nil |
NAV per unit as on 31st January, 2024 |
Regular Growth Option 3837.8319 Regular IDCW Option 1046.1477 Direct Growth Option 4083.1403 Direct IDCW Option 1358.3927 |
Benchmark Index |
CRISIL Ultra Short Duration Debt B-I Index |
| SIP/SWP/STRIP | |
| Fund Size | 1849.85 Crore (Monthly Average as on 31/1/2024) |
UTI Ultra Short Term Fund (Formerly known as UTI Floating Rate Fund STP) - IDCW Declared |
||||||
Year |
IDCW |
Rs. Per unt |
NAV |
Face Value |
NAV Date |
Record Date |
(Cum Div ) |
(per unit) |
|||||
2018 |
1.00% |
10.00 |
1072.500 |
1000.00 |
19-12-2018 |
26-12-2018 |
2019 |
2.00% |
20.00 |
1081.776 |
1000.00 |
18-03-2019 |
25-03-2019 |
2019 |
1.00% |
10.00 |
1078.279 |
1000.00 |
19-12-2019 |
26-12-2019 |
2020 |
0.50% |
5.00 |
1074.406 |
1000.00 |
19-03-2020 |
26-03-2020 |
2020 |
0.75% |
7.50 |
1093.409 |
1000.00 |
17-06-2020 |
24-06-2020 |
2020 |
1.00% |
10.00 |
1098.556 |
1000.00 |
16-09-2020 |
23-09-2020 |
2020 |
0.75% |
7.50 |
1101.2983 |
1000.00 |
14/12/2020 |
21/12/2020 |
2021 |
0.25% |
2.50 |
1097.2161 |
1000.00 |
16/06/2021 |
23/06/2021 |
2021 |
0.75% |
7.50 |
1104.1735 |
1000.00 |
15/09/2021 |
22/09/2021 |
2021 |
1.50% |
15.00 |
1135.0707 |
1000.00 |
16-12-2021 |
23/12/2021 |
2022 |
1.50% |
15.00 |
1129.0981 |
1000.00 |
15-03-2022 |
22-03-2022 |
2022 |
0.25% |
2.50 |
1121.2537 |
1000.00 |
15-06-2022 |
22-06-2022 |
2022 |
0.75% |
7.50 |
1132.6741 |
1000.00 |
14-09-2022 |
21-09-2022 |
2022 |
0.75% |
7.50 |
1139.7173 |
1000.00 |
14-12-2022 |
21-12-2022 |
2023 |
0.75% |
7.50 |
1149.6406 |
1000.00 |
15-03-2023 |
21-03-2023 |
2023 |
0.80% |
8.00 |
1171.5127 |
1000.00 |
11-09-2023 |
15-09-2023 |
2023 |
0.80% |
8.00 |
1181.8613 |
1000.00 |
11-12-2023 |
15-12-2023 |
The scheme IDCW details under regular plan.
Disclaimer: Pursuant to payment of Dividend/Bonus, the Nav of the income distribution cum capital withdrawal options of the schemes would fall to the extent of payout and statutory levy (if applicable)
Portfolio |
% of Nav |
Rating |
| CP / CDs | ||
| Small Industries Development Bank Of India | 9.20 |
CARE AAA/A1+ |
| HDFC Bank Ltd. | 7.98 |
CARE AAA/A1+ |
| Piramal Capital And Housing Finance Ltd. | 4.10 |
CRISIL AAA/A1+ |
| National Bank For Agriculture And Rural Development | 4.01 |
ICRA AAA/A1+ |
| Kotak Mahindra Bank Ltd. | 3.96 |
CRISIL AAA/A1+ |
| Shriram Finance Ltd | 2.73 |
CRISIL AAA/A1+ |
| Export Import Bank Of India | 2.73 |
CRISIL AAA/A1+ |
| Mindspace Business Parks REIT | 2.68 |
CRISIL AAA/A1+ |
| ICICI Bank Ltd | 2.68 |
ICRA AAA/A1+ |
| Nuvama Wealth & Investments Ltd | 2.65 |
CRISIL AAA/A1+ |
| AU Small Finance Bank Ltd | 2.63 |
CARE AAA/A1+ |
| Motilal Oswal Finvest Ltd | 2.18 |
CRISIL AAA/A1+ |
| Nuvama Wealth Management Ltd | 1.37 |
CRISIL AAA/A1+ |
| Fedbank Financial Services Ltd. | 1.36 |
CRISIL AAA/A1+ |
| DMI Finance Pvt Ltd | 1.36 |
ICRA AAA/A1+ |
| Motilal Oswal Financial Services Ltd. | 1.31 |
ICRA AAA/A1+ |
| Canara Bank | 1.28 |
CRISIL AAA/A1+ |
| JM Financial Services Ltd. | 1.26 |
CRISIL AAA/A1+ |
| NCDs | ||
| G R Infraprojects Ltd | 3.23 |
CARE AA+ |
| Torrent Power Ltd. | 2.75 |
CRISIL AA+ |
| LIC Housing Finance Ltd. | 2.74 |
CRISIL AAA/A1+ |
| Jamnagar Utilities And Power Private Ltd. ^ | 2.22 |
CRISIL AAA/A1+ |
| Godrej Industries Ltd. | 1.75 |
CRISIL AA |
| India Grid Trust | 1.38 |
CRISIL AAA/A1+ |
| National Housing Bank | 1.38 |
CRISIL AAA/A1+ |
| Motilal Oswal Finvest Ltd | 1.38 |
CRISIL AA |
| Hinduja Leyland Finance Ltd. | 1.37 |
CRISIL AA |
| GIC Housing Finance Ltd. | 1.37 |
CRISIL AA+ |
| Mindspace Business Parks REIT | 1.37 |
CRISIL AAA/A1+ |
| REC Ltd | 1.37 |
CRISIL AAA/A1+ |
| Embassy Office Parks REIT | 1.36 |
CRISIL AAA/A1+ |
| National Bank For Agriculture And Rural Development | 1.36 |
CRISIL AAA/A1+ |
| Tata Projects Ltd | 1.36 |
IND AA |
| Avanse Financial Services Ltd. | 1.10 |
CARE AA- |
| Apollo Tyres Ltd. | 1.10 |
CRISIL AA+ |
| Reliance Industries Ltd. | 0.89 |
CRISIL AAA/A1+ |
| Canfin Homes Ltd. | 0.70 |
ICRA AAA/A1+ |
| Power Grid Corporation Of India Ltd | 0.55 |
CRISIL AAA/A1+ |
| Shriram Finance Ltd | 0.28 |
CRISIL AA+ |
| 360 One Prime Ltd | 0.22 |
CRISIL AA |
| Tata Motors Ltd. | 0.16 |
CRISIL AA |
| Govt Securities | ||
| 364 DAYS T - BILL - 22/03/2024 | 5.46 |
SOV |
| 182 DAYS T BILL - 29/03/2024 | 2.73 |
SOV |
| Corporate Debt Market Development Fund | ||
| Corporate Debt Market Devt Fund - A2 Units | 0.28 |
|
| Net Current assets | 4.69 |
|
Total |
100.00 |
^ Mukesh Ambani promoter Group company
| Fund Performance Vs Benchmark (CAGR) as on 31st January, 2024 Growth of 10000 |
||||||
| Period | NAV Growth (%) |
CRISIL Ultra Short Duration Debt B-I Index (%) |
CRISIL 1 Year T-Bill Index (%) |
NAV Growth () |
CRISIL Ultra Short Duration Debt B-I Index () |
CRISIL 1 Year T-Bill Index () |
| 1 Y | 6.84 |
7.69 |
6.91 |
10,684 |
10,769 |
10,691 |
| 3 Y | 5.81 |
5.83 |
5.00 |
11,846 |
11,853 |
11,576 |
| 5 Y | 5.10 |
6.19 |
5.55 |
12,825 |
13,505 |
13,103 |
| SI* | 6.80 |
7.25 |
5.89 |
38,366 |
41,809 |
32,210 |
Different plans have a different expense structure. The performance details provided herein are of regular plan.
The current fund manager is managing the scheme since Jul 2012 & Co- Fund Manager managing w.e.f Jul 2015.
*Compounded annualized Growth Rate.
For performance details of other Schemes managed by the Fund Manager, please refer the respective Scheme sheets as listed Please click here in ‘Fund Manager Summary’. Schemes Managed by Mr. Ritesh Nambiar.Load is not taken into consideration for computation of performance.
| Period | |||||||
|
Investment Amount ()
|
Value- Fund ()
|
CRISIL Ultra Short Duration Debt B-I Index ()
|
CRISIL 1 Year
T-Bill Index () |
Yield (%)
Fund |
Yield (%)
CRISIL Ultra Short Duration Debt B-I Index |
Yield (%)
CRISIL 1 Year T-Bill Index |
|
1 Y |
120,000 |
124,322 |
124,874 |
124,514 |
6.72 |
7.59 |
7.02 |
3 Y |
360,000 |
394,727 |
397,884 |
392,837 |
6.07 |
6.60 |
5.75 |
5 Y |
600,000 |
692,722 |
700,344 |
686,720 |
5.68 |
6.12 |
5.34 |
7 Y |
840,000 |
1,022,926 |
1,050,361 |
1,024,236 |
5.54 |
6.29 |
5.58 |
10 Y |
1,200,000 |
1,622,858 |
1,683,624 |
1,624,385 |
5.88 |
6.59 |
5.90 |
15 Y |
1,800,000 |
3,020,592 |
3,171,520 |
2,934,121 |
6.57 |
7.16 |
6.21 |
SI |
2,300,000 |
4,624,033 |
4,906,671 |
4,325,794 |
6.79 |
7.34 |
6.18 |
Note: Systematic Investment Plan (SIP) returns are worked out assuming investment of 10,000/- every month at NAV per unit of the scheme as on the first working day for the respective time periods. The loads have not been taken into account. Past performance may or may not be sustained in future.
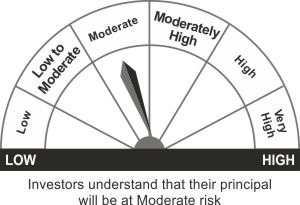
*Investors should consult their Mutual Fund Distributor if in doubt about whether the product is suitable for them.
- Reasonable with low volatility over short term
- Investment in debt & money market instruments
*Investors should consult their financial advisers if in doubt about whether the product is suitable for them.