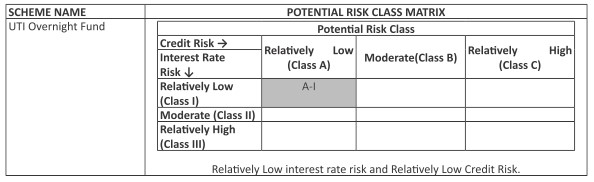
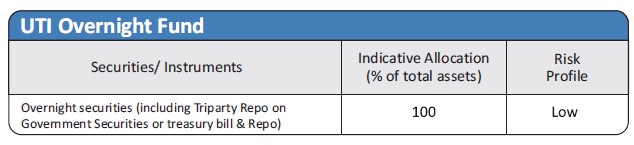
| Investment Objective The investment objective of the scheme is to generate reasonable income, with low risk and high level of liquidity from a portfolio of overnight securities having a maturity of one day. However there can be no assurance that the investment objective of the Scheme will be achieved. The Scheme does not guarantee / indicate any returns. |
|
| Inception Date |
24th November, 2003 |
| Fund Manager |
Mr. Amit Sharma (B.Com, CA, FRM) Managing the scheme since May 2018 |
| Fund AUM |
Fund size monthly average :7123.09 Crore Closing AUM : 7043.84 Crore |
| High/Low NAV in the month |
High Growth Option : 3209.6911 Low Growth Option : 3192.2252 |
Total expense ratio (%) |
Regular : 0.10 Direct : 0.05 |
Minimum Investment Amount |
Minimum initial investment under Growth option is Rs.500/- and in multiples of Re.1/-. & under IDCW option is Rs. 20,000/- and in multiples of Re.1/- |
Plans/Options
(Regular / Direct) |
Growth Option, Periodic Option with payout & reinvestment of IDCW Daily Reinvestment of IDCW Option |
| Portfolio Parameters | Weighted Average Maturity : 1 Day Yield to Maturity* :6.71% Modified Duration : 1 day Macaulay Duration : 1 day *Annualized Portfolio YTM – Yields of all securities are annualized |
Load Structure |
Entry Load : Nil Exit Load : Nil |
NAV per unit as on 31st January, 2024 |
Regular Growth Option 3209.6911 Regular IDCW Option 1370.8617 Direct Growth Option 3242.2201 Direct IDCW Option 1371.6621 |
Options Available |
SIP & Trigger Option |
Benchmark Index |
CRISIL Liquid Overnight Index |
| SIP/SWP/STRIP | |
| Fund Size | 7123.09 Crore (Monthly Average as on 31/1/2024) |
UTI Overnight Fund (Formerly known as UTI UTI G-SEC STP) - IDCW Declaration |
||||||
Year |
IDCW |
Per unt |
NAV (Cum Div ) |
Face Value (per unit) |
NAV Date |
Record Date |
2006 |
2.25% |
0.225 |
10.65 |
10.00 |
9/29/2006 |
10-06-2006 |
2007 |
2.50% |
0.250 |
10.7471 |
10.00 |
3/30/2007 |
04-06-2007 |
2007 |
2.75% |
0.275 |
10.8159 |
10.00 |
9/28/2007 |
10-05-2007 |
2008 |
2.25% |
0.225 |
10.8738 |
10.00 |
9/30/2008 |
10-07-2008 |
2009 |
3.00% |
0.300 |
11.2318 |
10.00 |
3/30/2009 |
04-06-2009 |
2009 |
0.05% |
0.050 |
10.916 |
10.00 |
9/30/2009 |
10-07-2009 |
2012 |
6.00% |
0.600 |
11.9718 |
10.00 |
3/28/2012 |
04-04-2012 |
2013 |
3.00% |
0.300 |
12.0232 |
10.00 |
3/18/2013 |
3/25/2013 |
2013 |
2.00% |
0.200 |
12.2042 |
10.00 |
9/19/2013 |
9/26/2013 |
2014 |
2.00% |
0.200 |
12.5067 |
10.00 |
3/19/2014 |
3/26/2014 |
2015 |
4.00% |
0.400 |
13.0042 |
10.00 |
3/19/2015 |
3/26/2015 |
2016 |
6.00% |
0.600 |
13.7856 |
10.00 |
21-03-2016 |
28-03-2016 |
2017 |
7.00% |
0.700 |
13.992 |
10.00 |
15-03-2017 |
22-03-2017 |
2018 |
4.00% |
0.400 |
14.0709 |
10.00 |
19-03-2018 |
26-03-2018 |
2019 |
4.00% |
40.000 |
1448.7274 |
1000.00 |
18-03-2019 |
25-03-2019 |
2020 |
4.00% |
40.000 |
1483.9871 |
1000.00 |
19-03-2020 |
26-03-2020 |
2020 |
3.00% |
30.000 |
1513.2932 |
1000.00 |
15-03-2022 |
22-03-2022 |
The scheme IDCW details under regular plan.
Disclaimer: Pursuant to payment of Dividend/Bonus, the Nav of the income distribution cum capital withdrawal options of the schemes would fall to the extent of payout and statutory levy (if applicable)
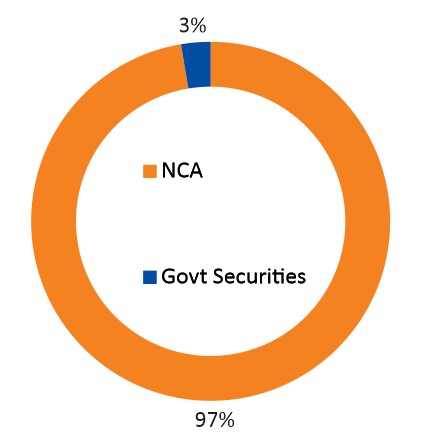
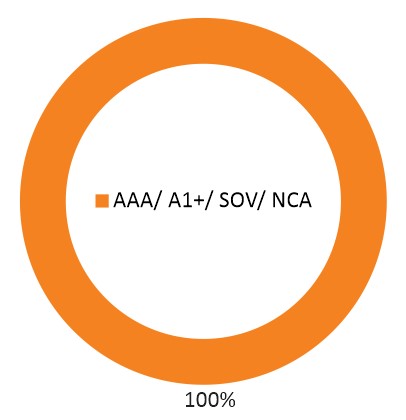
| Portfolio | % of Nav |
Rating |
| Govt Securities | ||
| 364 D TBILL MAT - 08/02/2024 | 1.42 |
SOV |
| 182 DAYS T BILL - 16/02/2024 | 1.42 |
SOV |
| 91 D TBILL MAT - 15/02/24 | 0.21 |
SOV |
| 91 D TBILL MAT - 08/02/24 | 0.14 |
SOV |
| Net Current assets | 96.81 |
|
| Total | 100.00 |
| Fund Performance Vs Benchmark (CAGR) as on 31st January, 2024 Growth of 10000 |
||||||
| Period | NAV Growth (%) |
CRISIL Liquid Overnight Index (%) |
CRISIL 1 Year T-Bill Index (%) |
NAV Growth () |
CRISIL Liquid Overnight Index () |
CRISIL 1 Year T-Bill Index () |
| 7 Days | 6.66 |
6.74 |
6.91 |
10,013 |
10,013 |
10,013 |
| 15 Days | 6.66 |
6.75 |
6.13 |
10,027 |
10,028 |
10,025 |
| 1 Month | 6.66 |
6.76 |
6.42 |
10,057 |
10,057 |
10,055 |
| 1 Y | 6.69 |
6.81 |
6.91 |
10,669 |
10,681 |
10,691 |
| 3 Y | 4.90 |
5.04 |
5.00 |
11,543 |
11,589 |
11,576 |
| 5 Y | 4.68 |
4.79 |
5.55 |
12,571 |
12,637 |
13,103 |
| SI* | 5.94 |
5.89 |
5.90 |
32,078 |
31,774 |
31,835 |
Different plans have a different expense structure. The performance details provided herein are of regular plan.
The current fund manager is managing the scheme since Dec 2006 & Co- Fund Manager managing w.e.f March 2018.
*Compounded annualized Growth Rate.
For performance details of other Schemes managed by the Fund Manager, please refer the respective Scheme sheets as listed Please click here in ‘Fund Manager Summary’. N.A - Not Available. Schemes Managed by Mr. Amit Sharma.Load is not taken into consideration for computation of performance
| Period | |||||||
|
Investment Amount ()
|
Value- Fund ()
|
CRISIL Liquid Overnight Index ()
|
CRISIL 1 Year
T-Bill Index () |
Yield (%) Fund
|
Yield (%)
CRISIL Liquid Overnight Index |
Yield (%)
CRISIL 1 Year T-Bill Index |
|
1 Y |
120,000 |
124,361 |
124,418 |
124,514 |
6.76 |
6.85 |
7.00 |
3 Y |
360,000 |
392,761 |
393,471 |
392,852 |
5.73 |
5.85 |
5.74 |
5 Y |
600,000 |
680,556 |
682,607 |
686,742 |
4.98 |
5.10 |
5.34 |
7 Y |
840,000 |
1,000,395 |
1,005,673 |
1,024,259 |
4.92 |
5.06 |
5.58 |
10 Y |
1,200,000 |
1,572,441 |
1,574,677 |
1,624,408 |
5.28 |
5.30 |
5.90 |
15 Y |
1,800,000 |
2,865,223 |
2,853,743 |
2,934,144 |
5.92 |
5.87 |
6.21 |
SI |
2,300,000 |
4,255,206 |
4,220,275 |
4,325,671 |
6.02 |
5.95 |
6.18 |
Note: Systematic Investment Plan (SIP) returns are worked out assuming investment of 10,000/- every month at NAV per unit of the scheme as on the first working day for the respective time periods. The loads have not been taken into account. Past performance may or may not be sustained in future.
*Investors should consult their Mutual Fund Distributor if in doubt about whether the product is suitable for them.:
- Reasonable income over one day with capital preservation
- Investment in overnight securities
*Investors should consult their financial advisers if in doubt about whether the product is suitable for them.