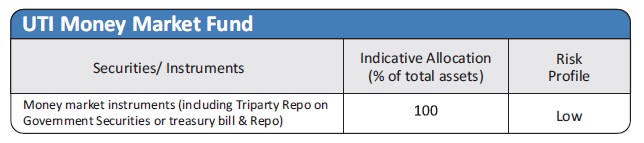
| Investment Objective The investment objective of the scheme is to generate reasonable income with high level of liquidity by investing in a portfolio of money market instruments. However there can be no assurance that the investment objective of the Scheme will be achieved. The Scheme does not guarantee / indicate any returns. |
|
| Inception Date |
23rd April, 1997 |
| Fund Manager |
Mr. Amit Sharma (B.Com, CA, FRM) Managing the scheme since Jul 2017 & Mr. Anurag Mittal, Deputy Head- Fixed Income & Fund Manager: C.A., Msc in Accounting & Finance, London School of Economics, UK Managing the scheme since Dec 2021 |
| Fund AUM |
Fund Size Monthly Average : 12095.34 Crore Closing AUM : 13353.08 Crore |
Plans/Option (Regular/Direct) |
Growth Option IDCW Option |
| High/Low NAV in the month |
High Growth Option : 2768.9284 Low Growth Option : 2753.2737 |
Total expense ratio (%) |
Regular : 0.27 Direct : 0.20 |
Minimum Investment Amount |
Minimum initial investment under Growth option is Rs.500/- and in multiples of Re.1/-. & under IDCW option is Rs.20,000/- and in multiples of Re.1/- |
| Portfolio Parameters | Weighted Average Maturity : 108 Days Yield to Maturity* : 7.60% Modified Duration : 108 days Macaulay Duration : 108 days *Annualized Portfolio YTM – Yields of all securities are annualized |
Load Structure |
Entry Load : Nil Exit Load : Nil |
NAV per unit as on 31st January, 2024 |
Regular Growth Option 2768.9284 Regular IDCW Option 1130.9150 Direct Growth Option 2798.9113 Direct IDCW Option 1030.9525 |
Benchmark Index |
CRISIL Money Market A-I Index |
| SIP/SWP/STRIP | |
| Fund Size | 12095.34 Crore (Monthly Average as on 31/1/2024) |
Portfolio |
% of Nav |
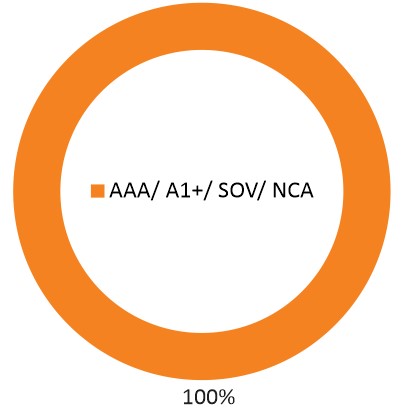
Rating |
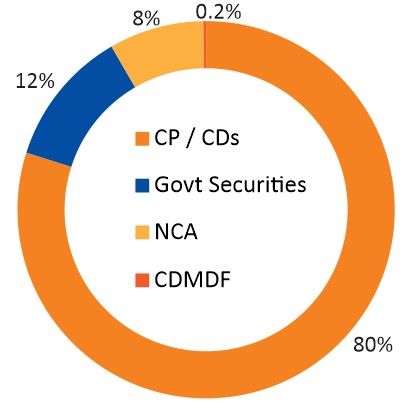
| CP / CDs | ||
| Small Industries Development Bank Of India | 8.84 |
CARE AAA/A1+ |
| ICICI Bank Ltd | 5.85 |
ICRA AAA/A1+ |
| HDFC Bank Ltd. | 5.58 |
CARE AAA/A1+ |
| DBS Bank India Ltd | 5.19 |
IND AAA/A1+ |
| Canara Bank | 5.12 |
CRISIL AAA/A1+ |
| Kotak Mahindra Bank Ltd. | 4.97 |
CRISIL AAA/A1+ |
| Export Import Bank Of India | 3.90 |
CRISIL AAA/A1+ |
| National Bank For Agriculture And Rural Development | 3.71 |
CRISIL AAA/A1+ |
| REC Ltd | 2.98 |
CRISIL AAA/A1+ |
| ICICI Securities Ltd. | 2.92 |
CRISIL AAA/A1+ |
| Federal Bank Ltd. | 2.87 |
CRISIL AAA/A1+ |
| Mahindra And Mahindra Financial Services Ltd | 2.79 |
CRISIL AAA/A1+ |
| Sikka Ports And Terminals Ltd. | 2.61 |
CRISIL AAA/A1+ |
| Shriram Finance Ltd | 2.60 |
CRISIL AAA/A1+ |
| IndusInd Bank Ltd. | 2.49 |
CRISIL AAA/A1+ |
| Piramal Capital And Housing Finance Ltd. | 2.23 |
CRISIL AAA/A1+ |
| Infina Finance Private Ltd. | 1.56 |
CRISIL AAA/A1+ |
| IGH Holdings Pvt Ltd | 1.56 |
CRISIL AAA/A1+ |
| Union Bank Of India | 1.48 |
IND AAA/A1+ |
| Motilal Oswal Financial Services Ltd. | 1.12 |
ICRA AAA/A1+ |
| Tata Motors Finance Ltd. | 1.11 |
CRISIL AAA/A1+ |
| Tata Capital Housing Finance Ltd | 1.11 |
CRISIL AAA/A1+ |
| Panatone Finvest Ltd. | 1.04 |
CRISIL AAA/A1+ |
| Mahindra Rural Housing Finance Ltd | 0.75 |
CRISIL AAA/A1+ |
| Indian Bank | 0.74 |
CRISIL AAA/A1+ |
| Birla Group Holdings Private Ltd. | 0.73 |
CRISIL AAA/A1+ |
| Tata Projects Ltd | 0.73 |
CRISIL AAA/A1+ |
| Cholamandalam Investment And Fin. Co. Ltd | 0.69 |
ICRA AAA/A1+ |
| Punjab & Sind Bank Ltd. | 0.66 |
ICRA AAA/A1+ |
| HSBC Investdirect Financial Services (I) Ltd. | 0.37 |
CRISIL AAA/A1+ |
| Reliance Retail Ventures Ltd. | 0.37 |
CRISIL AAA/A1+ |
| Muthoot Finance Ltd | 0.37 |
CRISIL AAA/A1+ |
| JM Financial Services Ltd. | 0.37 |
CRISIL AAA/A1+ |
| Tata Teleservices Ltd. | 0.30 |
CRISIL AAA/A1+ |
| Fedbank Financial Services Ltd. | 0.19 |
CRISIL AAA/A1+ |
| Govt Securities | ||
| 182 DAYS T BILL - 21/03/2024 | 2.15 |
SOV |
| 182 DAYS T BILL - 29/02/2024 | 1.49 |
SOV |
| 182 DAYS T BILL - 07/03/2024 | 1.49 |
SOV |
| 182 DAYS T BILL - 14/03/2024 | 1.49 |
SOV |
| 182 DAYS T BILL - 06/06/2024 | 1.46 |
SOV |
| 364 DAYS T - BILL- 07/03/2024 | 1.38 |
SOV |
| 364 DAYS T - BILL - 14/03/2024 | 0.74 |
SOV |
| 364 DAYS T - BILL - 22/03/2024 | 0.74 |
SOV |
| GS - C STRIP MAT- 12/06/2024 | 0.42 |
SOV |
| 182 DAYS T BILL - 22/02/2024 | 0.37 |
SOV |
| Corporate Debt Market Development Fund | ||
| Corporate Debt Market Devt Fund - A2 Units | 0.23 |
|
| Net Current assets | 8.13 |
|
| Total | 100.00 |
| Fund Performance Vs Benchmark (CAGR) as on 31st January, 2024 Growth of 10000 |
||||||
| Period | NAV Growth (%) |
CRISIL Money Market A-I Index (%) |
CRISIL 1 Year T-Bill Index (%) |
NAV Growth () |
CRISIL Money Market A-I Index () |
CRISIL 1 Year T-Bill Index () |
| 7 Days | 7.11 |
7.25 |
6.91 |
10,014 |
10,014 |
10,013 |
| 15 Days | 6.53 |
6.77 |
6.13 |
10,027 |
10,028 |
10,025 |
| 1 Month | 7.01 |
7.15 |
6.42 |
10,060 |
10,061 |
10,055 |
| 1 Y | 7.53 |
7.42 |
6.91 |
10,753 |
10,742 |
10,691 |
| 3 Y | 5.50 |
5.50 |
5.00 |
11,742 |
11,742 |
11,576 |
| 5 Y | 5.99 |
5.71 |
5.55 |
13,378 |
13,202 |
13,103 |
| SI* | 7.24 |
7.03 |
6.10 |
27,688 |
26,909 |
23,696 |
Different plans have a different expense structure. The performance details provided herein are of regular plan.
The current fund manager is managing the scheme since Oct 2013 & Co- Fund Manager managing w.e.f 7th August 2017.
*Compounded annualized Growth Rate.
For performance details of other Schemes managed by the Fund Manager, please refer the respective Scheme sheets as listed Please click here in ‘Fund Manager Summary’. Schemes Managed by Mr. Anurag Mittal & Mr. Amit Sharma. **The Institution plan (Growth Option) launch on 10th August 2009. Load is not taken into consideration for computation of performance
| Period | |||||||
|
Investment Amount ()
|
Value- Fund
() |
CRISIL Money Market A-I
Index () |
CRISIL 1 Year
T-Bill Index () |
Yield (%) Fund
|
Yield (%)
CRISIL Money Market A-I Index |
Yield (%)
CRISIL 1 Year T-Bill Index |
|
1 Y |
120,000 |
124,723 |
124,720 |
124,514 |
7.35 |
7.35 |
7.02 |
3 Y |
360,000 |
396,122 |
396,144 |
392,837 |
6.31 |
6.31 |
5.75 |
5 Y |
600,000 |
695,454 |
693,379 |
686,720 |
5.84 |
5.72 |
5.34 |
7 Y |
840,000 |
1,042,547 |
1,035,102 |
1,024,247 |
6.08 |
5.87 |
5.58 |
10 Y |
1,200,000 |
1,667,636 |
1,651,124 |
1,624,408 |
6.40 |
6.21 |
5.90 |
SI |
1,740,000 |
2,959,786 |
2,919,604 |
2,790,563 |
6.97 |
6.80 |
6.22 |
Note: Systematic Investment Plan (SIP) returns are worked out assuming investment of 10,000/- every month at NAV per unit of the scheme as on the first working day for the respective time periods. The loads have not been taken into account. Past performance may or may not be sustained in future.
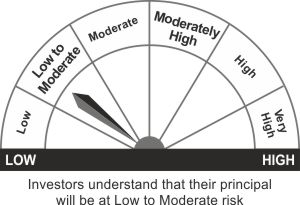
*Investors should consult their Mutual Fund Distributor if in doubt about whether the product is suitable for them.
- Reasonable with high level of liquidity over short-term
- Investment in money market securities
*Investors should consult their financial advisers if in doubt about whether the product is suitable for them.