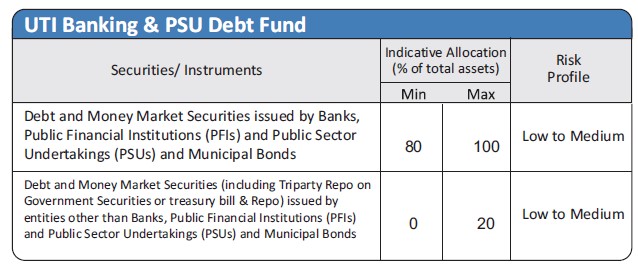
| Investment Objective The investment objective of the scheme is to generate reasonable income, with low risk and high level of liquidity from a portfolio of predominantly debt & money market securities by Banks, Public Sector Undertakings (PSUs), Public Financial Institutions (PFIs) and Municipal Bonds. However there can be no assurance that the investment objective of the Scheme will be achieved. The Scheme does not guarantee / indicate any returns. |
|
Inception Date |
27th January, 2014 |
Fund Manager |
Mr. Anurag Mittal, Deputy Head- Fixed Income & Fund Manager: C.A., Msc in Accounting & Finance, London School of Economics, UK Managing the scheme since Dec 2021 |
Fund AUM |
Fund size monthly average : 943.64 Crore Closing AUM : 944.16 Crore |
High/Low NAV in the month |
High Growth Option : 19.6161 Low Growth Option : 19.4951 |
Total expense ratio (%) |
Regular : 0.57 Direct : 0.24 |
Minimum Investment Amount |
Minimum initial investment under Growth option is Rs.500/- and in multiples of Re.1/-. & under IDCW option is Rs.20,000/- and in multiples of Re.1/- |
Plans/Options
(Regular / Direct) |
Growth option Mthly/Qtly/HalfYearly/Annual/Flexi Payout & Reinvestment IDCW Option |
| Portfolio Parameters | Weighted Average Maturity : 3.38 Yrs *Annualized Portfolio YTM – Yields of all securities are annualized |
Load Structure |
Entry Load : Nil Exit Load : Nil |
NAV per unit as on 31st January, 2024 |
Regular Growth Option 19.6161 Regular IDCW Option 13.1546 Direct Growth Option 19.8855 Direct IDCW Option 17.1359 |
Benchmark Index |
CRISIL Banking and PSU Debt Index |
| Fund Size | 943.64 Crore (Monthly Average as on 31/1/2024) |
UTI Banking & PSU Debt Fund - IDCW Declared |
||||||
Year |
IDCW |
Per unt |
NAV (Cum Div ) |
Face Value (per unit) |
NAV Date |
Record Date |
2015 |
1.50% |
0.150 |
10.4645 |
10.00 |
21-12-2015 |
28-12-2015 |
2016 |
2.50% |
0.250 |
11.2802 |
10.00 |
21-03-2016 |
28-03-2016 |
2016 |
1.50% |
0.150 |
11.2826 |
10.00 |
20-06-2016 |
27-06-2016 |
2016 |
1.50% |
0.150 |
10.7366 |
10.00 |
19-09-2016 |
26-09-2016 |
2016 |
1.50% |
0.150 |
10.9412 |
10.00 |
19-12-2016 |
26-12-2016 |
2017 |
2.50% |
0.250 |
10.9018 |
10.00 |
15-03-2017 |
22-03-2017 |
2017 |
1.50% |
0.150 |
10.9302 |
10.00 |
21-06-2017 |
28-06-2017 |
2017 |
1.50% |
0.150 |
10.9452 |
10.00 |
18-09-2017 |
25-09-2017 |
2017 |
1.50% |
0.150 |
10.9373 |
10.00 |
19-12-2017 |
26-12-2017 |
2018 |
1.50% |
0.150 |
10.9148 |
10.00 |
19-03-2018 |
26-03-2018 |
2018 |
0.30% |
0.030 |
10.8702 |
10.00 |
19-06-2018 |
26-06-2018 |
2018 |
1.00% |
0.100 |
11.0165 |
10.00 |
18-09-2018 |
25/09/2018 |
2018 |
1.20% |
0.120 |
11.2040 |
10.00 |
19-12-2018 |
26-12-2018 |
2019 |
1.50% |
0.150 |
11.0514 |
10.00 |
18-03-2019 |
25-03-2019 |
2020 |
1.00% |
0.100 |
11.3820 |
10.00 |
17-06-2020 |
24-06-2020 |
2020 |
1.00% |
0.100 |
11.4756 |
10.00 |
16-09-2020 |
23-09-2020 |
2020 |
1.00% |
0.100 |
11.5779 |
10.00 |
14/12/2020 |
21/12/2020 |
2021 |
0.50% |
0.050 |
11.4186 |
10.00 |
16/06/2021 |
23/06/2021 |
2021 |
0.75% |
0.075 |
11.4837 |
10.00 |
15/09/2021 |
22/09/2021 |
2021 |
0.75% |
0.075 |
11.4779 |
10.00 |
16/12/2021 |
23/12/2021 |
2022 |
0.50% |
0.050 |
12.0850 |
10.00 |
16/06/2022 |
22/06/2022 |
The scheme IDCW details under regular plan.
Disclaimer: Pursuant to payment of Dividend/Bonus, the Nav of the income distribution cum capital withdrawal options of the schemes would fall to the extent of payout and statutory levy (if applicable)
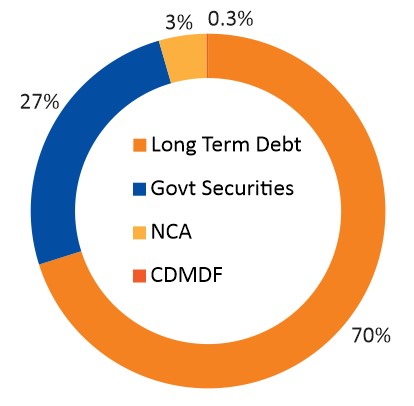
Portfolio |
% of Nav |
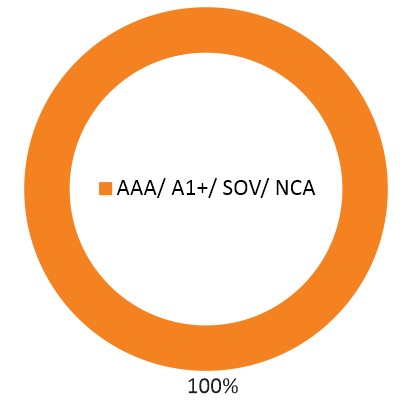
Rating |
| Govt Securities | ||
| 7.38% GSEC 20/06/2027 | 22.47 |
SOV |
| 7.06% GS MAT - 10/04/2028 | 2.12 |
SOV |
| 7.17% GSEC 08/01/2028 | 1.06 |
SOV |
| GS - C STRIP MAT- 15/12/2027 | 0.56 |
SOV |
| 7.85% TN SDL MAT - 15/03/2027 | 0.54 |
SOV |
| Long Term Debt | ||
| REC Ltd | 9.01 |
CRISIL AAA/A1+ |
| National Bank For Agriculture And Rural Development | 8.97 |
CRISIL AAA/A1+ |
| Power Finance Corporation Ltd. | 8.48 |
CRISIL AAA/A1+ |
| Indian Railway Finance Corporation Ltd. | 8.47 |
CRISIL AAA/A1+ |
| ICICI Bank Ltd | 7.62 |
ICRA AAA/A1+ |
| Small Industries Development Bank Of India | 5.80 |
CRISIL AAA/A1+ |
| Axis Bank Ltd. | 5.80 |
CRISIL AAA/A1+ |
| Export Import Bank Of India | 5.28 |
CRISIL AAA/A1+ |
| HDFC Bank Ltd. | 4.23 |
CARE AAA/A1+ |
| NHPC Ltd. | 2.62 |
ICRA AAA/A1+ |
| Indian Oil Corporation Ltd. | 2.55 |
CRISIL AAA/A1+ |
| National Housing Bank | 1.58 |
CRISIL AAA/A1+ |
| Corporate Debt Market Development Fund | ||
| Corporate Debt Market Devt Fund - A2 Units | 0.25 |
|
| Net Current Assets | 2.60 |
|
| Total | 100.00 |
| Fund Performance Vs Benchmark (CAGR) as on 31st January,2024 Growth of 10000
|
||||||
| Period | NAV Growth (%) |
CRISIL Banking and PSU Debt Index (%) |
CRISIL 10 Year Gilt Index (%) |
NAV Growth () |
CRISIL Banking and PSU Debt Index () |
CRISIL 10 Year Gilt Index () |
| 1 Y | 6.94 |
7.13 |
8.25 |
10,694 |
10,713 |
10,825 |
| 3 Y | 6.81 |
4.85 |
3.39 |
12,185 |
11,527 |
11,052 |
| 5 Y | 5.95 |
6.91 |
5.98 |
13,353 |
13,969 |
13,372 |
| SI* | 6.97 |
7.95 |
7.01 |
19,613 |
21,485 |
19,686 |
Different plans have a different expense structure. The performance details provided herein are of regular plan.
*Compounded annualized Growth Rate.
For performance details of other Schemes managed by the Fund Manager, please refer the respective Scheme sheets as listed in Please click here in ‘Fund Manager Summary’.
Schemes Managed by Mr. Anurag Mittal.Load is not taken into consideration for computation of performance.
| Period | |||||||
|
Investment Amount ()
|
Value- Fund ()
|
CRISIL Banking
and PSU Debt Index () |
CRISIL 10 Year
Gilt Index () |
Yield (%) Fund
|
Yield (%)
CRISIL Banking and PSU Debt Index |
Yield (%)
CRISIL 10 Year Gilt Index |
|
1 Y |
120,000 |
124,332 |
124,466 |
124,901 |
6.74 |
6.95 |
7.63 |
3 Y |
360,000 |
402,990 |
391,919 |
390,039 |
7.46 |
5.59 |
5.27 |
5 Y |
600,000 |
715,280 |
695,350 |
678,251 |
6.96 |
5.84 |
4.85 |
7 Y |
840,000 |
1,050,946 |
1,054,433 |
1,015,731 |
6.30 |
6.39 |
5.34 |
SI |
1,190,000 |
1,652,993 |
1,697,182 |
1,604,890 |
6.45 |
6.96 |
5.88 |
Note: Systematic Investment Plan (SIP) returns are worked out assuming investment of 10,000/- every month at NAV per unit of the scheme as on the first working day for the respective time periods. The loads have not been taken into account. Past performance may or may not be sustained in future.
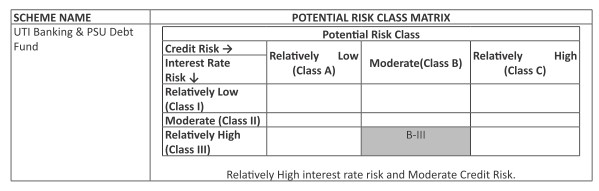
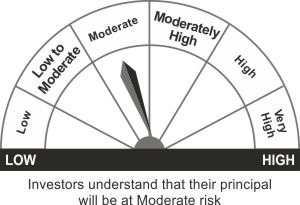
*Investors should consult their Mutual Fund Distributor if in doubt about whether the product is suitable for them.:
- Reasonable income, with low risk and high level of liquidity over short to medium term
- Investment predominantly in Debt & Money Market Securities issued by Bank, Public Sector Undertaking (PSUs),Public Financial Institutions (PFIs) and Municipal Bonds
*Investors should consult their financial advisers if in doubt about whether the product is suitable for them.
@The fund intends to follow a roll-down strategy starting June 2022, and the portfolio maturity will ordinarily reduce with time.