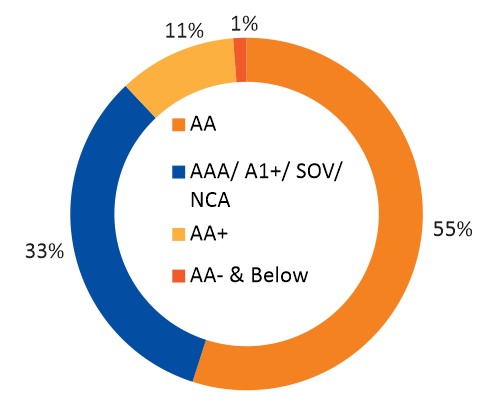
| Investment Objective The investment objective of the scheme is to generate reasonable income and capital appreciation by investing minimum of 65% of total assets in AA and below rated corporate bonds (excluding AA+ rated corporate bonds). However there can be no assurance that the investment objective of the Scheme will be achieved. The Scheme does not guarantee / indicate any returns. |
|
Inception Date |
19th November, 2012 |
Fund Manager |
Mr. Ritesh Nambiar (CFA, FRM, MMS [Finance]), BMS(Fin) Managing the scheme since Aug-2014 |
Fund AUM |
Fund size monthly average : 414.24 Crore Closing AUM : 409.61 Crore |
Total expense ratio (%) |
Regular : 1.64 Direct : 0.89 |
Minimum Investment Amount |
Minimum initial investment under Growth option is Rs.500/- and in multiples of Re.1/-. & under IDCW option is Rs.20,000/- and in multiples of Re.1/- |
Plans/Options
(Regular / Direct) |
Gowth Option Monthly IDCW /Quarterly IDCW/Half Yearly IDCW & Flexi IDCW Option with Payout and Reinvestment facilities |
| Portfolio Parameters | Weighted Average Maturity :2.79 Yrs Yield to Maturity* : 8.45% Modified Duration : 2.04 Yrs Macaulay Duration : 2.14 Yrs *Annualized Portfolio YTM – Yields of all securities are annualized |
Load Structure |
Entry Load : Nil Exit Load (A) Redemption / Switch out within 12 months from the date of allotment – (i) upto 10% of the allotted Units – NIL (ii) beyond 10% of the allotted Units - 1.00 % (B) Redemption / Switch out after 12 months from the date of allotment – NIL |
Segregated AUM & NAV |
Segregated Fund Size Monthly Average - 17022020 :0.0 Crore Closing AUM: 0.0 Crore Segregated Fund Size Monthly Average - 06032020 : 0.0 Crore Closing AUM: 0.0 Crore Segregated NAV per unit as on - 17022020 31st January, 2024 Growth : 0.0 |
NAV per unit as on 31st January, 2024 |
Regular Growth Option 15.2871 Regular IDCW Option 9.9239 Direct Growth Option 17.1104 Direct IDCW Option 10.8606 |
High/Low of NAV in the month |
High Growth Option : 15.2871 Low Growth Option: 15.1989 |
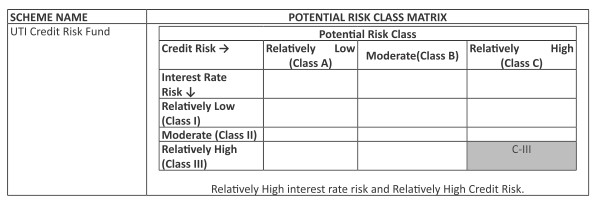
Benchmark Index |
CRISIL Credit Risk Debt C-II Index |
| SIP/SWP/STRIP | |
| Fund Size | 414.24 Crore (Monthly Average as on 31/1/2024) |
UTI Credit Risk Fund (Formerly known as UTI Income Opportunities Fund) - IDCW Declared |
||||||
Year |
IDCW |
Rs. Per unt |
NAV |
Face Value |
NAV Date |
Record Date |
(Cum Div ) |
(per unit) |
|||||
2014 |
1.50% |
0.15 |
10.9267 |
10 |
22-12-2014 |
29-12-2014 |
2015 |
2.00% |
0.2 |
11.0319 |
10 |
19-03-2015 |
26-03-2015 |
2015 |
1.25% |
0.125 |
11.058 |
10 |
18-06-2015 |
25-06-2015 |
2015 |
1.25% |
0.125 |
11.1633 |
10 |
21-09-2015 |
28-09-2015 |
2015 |
1.25% |
0.125 |
11.2764 |
10 |
21-12-2015 |
28-12-2015 |
2016 |
3.25% |
0.325 |
11.3754 |
10 |
21-03-2016 |
28-03-2016 |
2016 |
1.50% |
0.15 |
11.6493 |
10 |
20-06-2016 |
27-06-2016 |
2016 |
1.50% |
0.15 |
11.5104 |
10 |
19-09-2016 |
26-09-2016 |
2016 |
1.50% |
0.15 |
11.6442 |
10 |
19-12-2016 |
26-12-2016 |
2017 |
2.50% |
0.25 |
11.6698 |
10 |
15-03-2017 |
22-03-2017 |
2017 |
1.50% |
0.15 |
12.3492 |
10 |
21-06-2017 |
28-06-2017 |
2017 |
1.50% |
0.15 |
11.7604 |
10 |
18-09-2017 |
25-09-2017 |
2017 |
1.50% |
0.15 |
11.7444 |
10 |
19-12-2017 |
26-12-2017 |
2018 |
1.50% |
0.15 |
11.7434 |
10 |
19-03-2018 |
26-03-2018 |
2018 |
0.30% |
0.03 |
11.6753 |
10 |
19-06-2018 |
26-06-2018 |
2018 |
0.45% |
0.045 |
11.7932 |
10 |
18-09-2018 |
25-09-2018 |
2018 |
1.25% |
0.125 |
11.9678 |
10 |
19-12-2018 |
26-12-2018 |
2019 |
2.00% |
0.2 |
12.0368 |
10 |
18-03-2019 |
25-03-2019 |
The scheme IDCW details under regular plan.
Disclaimer: Pursuant to payment of Dividend/Bonus, the Nav of the income distribution cum capital withdrawal options of the schemes would fall to the extent of payout and statutory levy (if applicable)
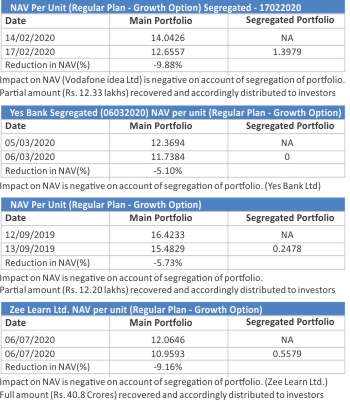
| UTI Credit Risk Fund (Segregated - 17022020) SEGREGATED Portfolio as on 31st January, 2024 | ||
| Portfolio | % of NAV |
Rating |
| Vodafone Idea Ltd | 0* |
CARE-B- |
| Vodafone Idea Ltd | 0* |
CARE-B- |
| Net Current Assets | 0* |
|
| Total | 100.00 |
|
| UTI Credit Risk Fund (Segregated -06032020) SEGREGATED Portfolio as on 31st January, 2024 | ||
| Portfolio | % of NAV |
Rating |
| Yes Bank Ltd. | 0* |
ICRA-D |
| * Percentage to NAV Less Than 0.01 | ||
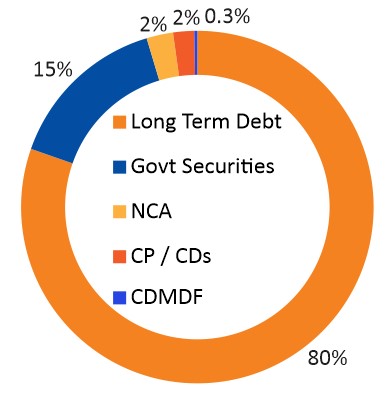
Portfolio |
% of Nav |
Rating |
| CP / CDs | ||
| Motilal Oswal Finvest Ltd | 1.93 |
IND AAA/A1+ |
| Govt Securities | ||
| 07.18% GSEC MAT -14/08/2033 | 6.73 |
SOV |
| 6.54% GSEC MAT - 17/01/2032 | 2.82 |
SOV |
| 7.10% GS MAT - 18/04/2029 | 2.44 |
SOV |
| 7.38% GSEC 20/06/2027 | 1.23 |
SOV |
| 07.78% RAJASTHAN SDL 29/03/2033 | 0.99 |
SOV |
| 7.79% UTTARPRADESH SDL 29/03/2033 | 0.54 |
SOV |
| 7.26% GSEC 22/08/2032 | 0.25 |
SOV |
| Long Term Debt | ||
| Piramal Capital And Housing Finance Ltd. | 6.41 |
ICRA AA |
| Tata Motors Ltd. | 6.15 |
ICRA AA |
| Godrej Industries Ltd. | 6.05 |
CRISIL AA |
| Summit Digitel Infrastructure Ltd | 5.96 |
CRISIL AAA/A1+ |
| Tata Projects Ltd | 5.79 |
IND AA |
| Kirloskar Ferrous Industries Ltd. | 5.60 |
ICRA AA |
| India Grid Trust | 4.98 |
CRISIL AAA/A1+ |
| Aditya Birla Fashion And Retail Ltd. | 4.80 |
IND AA+ |
| TMF Holdings Ltd | 4.22 |
CRISIL AA |
| TVS Credit Services Ltd | 3.69 |
CRISIL AA |
| PNB Housing Finance Ltd. | 3.67 |
CRISIL AA |
| G R Infraprojects Ltd | 3.59 |
CARE AA+ |
| Century Textiles & Industries Ltd. | 3.39 |
CRISIL AA |
| Steel Authority Of India Ltd. | 3.06 |
IND AA |
| 360 One Prime Ltd | 2.44 |
CRISIL AA |
| Tata Power Company Ltd. | 2.44 |
IND AA+ |
| Small Industries Development Bank Of India | 2.41 |
ICRA AAA/A1+ |
| Aadhar Housing Finance Ltd. | 2.41 |
CARE AA |
| Motilal Oswal Finvest Ltd | 2.07 |
CRISIL AA |
| Avanse Financial Services Ltd. | 1.22 |
CARE AA- |
| Corporate Debt Market Development Fund | ||
| Corporate Debt Market Devt Fund - A2 Units | 0.28 |
|
| Net Current assets | 2.44 |
|
| Total | 100.00 |
Under Segregated portfolio (Subscription & redemption facility is not available however the unit of Segregated portfolio will be listed on the recognized stock exchange.
| Fund Performance Vs Benchmark (CAGR) as on 31st January, 2024 Growth of 10000
|
||||||
| Period | NAV Growth (%) |
CRISIL Credit Risk Debt C-II Index (%) |
CRISIL 10 Year Gilt Index (%) |
NAV Growth () |
CRISIL Credit Risk Debt C-II Index () |
Yield (%) CRISIL 10 Year Gilt Index () |
| 1 Y | 6.68 |
9.23 |
8.25 |
10,668 |
10,923 |
10,825 |
| 3 Y | 10.55 |
7.98 |
3.39 |
13,511 |
12,590 |
11,052 |
| 5 Y | -1.52 |
8.91 |
5.98 |
9,262 |
15,326 |
13,372 |
| SI* | 3.86 |
9.25 |
6.47 |
15,287 |
26,948 |
20,188 |
Different plans have a different expense structure. The performance details provided herein are of regular plan.
*Compounded annualized Growth Rate.For performance details of other Schemes managed by the Fund Manager, please refer the respective Scheme sheets as listed Please click here
in ‘Fund Manager Summary’. Schemes Managed by Mr. Ritesh Nambiar. *The Scheme returns are inclusive of the impact of segregation of the portfolio Debt
instruments of Altico Capital India Ltd, Vodafone Idea Ltd, Yes Bank Ltd and Zee Learn Ltd. have been segregated from the Main Portfolio on 13th Sep, 2019 17th Feb 2020, 6th March 2020 and 7th August, 2020 Respectively. Load is not taken into consideration for computation of performance.
| Period | |||||||
|
Investment Amount ()
|
Value- Fund
() |
CRISIL Credit Risk Debt C-II Index ()
|
CRISIL 10 Year
Gilt Index () |
Yield (%) Fund
|
Yield (%)
CRISIL Credit Risk Debt C-II Index |
Yield (%)
CRISIL 10 Year Gilt Index |
|
1 Y |
120,000 |
124,203 |
125,723 |
124,901 |
6.54 |
8.93 |
7.63 |
3 Y |
360,000 |
407,158 |
407,936 |
390,039 |
8.15 |
8.28 |
5.27 |
5 Y |
600,000 |
677,215 |
742,738 |
678,251 |
4.78 |
8.47 |
4.85 |
7 Y |
840,000 |
912,712 |
1,141,442 |
1,015,731 |
2.34 |
8.62 |
5.34 |
10 Y |
1,200,000 |
1,347,549 |
1,889,928 |
1,624,571 |
2.28 |
8.79 |
5.90 |
SI |
1,340,000 |
1,551,975 |
2,250,450 |
1,896,749 |
2.58 |
8.92 |
6.03 |
Note: Systematic Investment Plan (SIP) returns are worked out assuming investment of 10,000/- every month at NAV per unit of the scheme as on the first working day for the respective time periods. The loads have not been taken into account. Past performance may or may not be sustained in future.
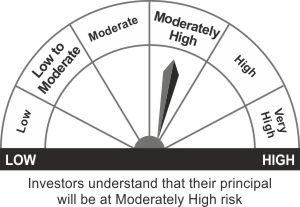
*Investors should consult their Mutual Fund Distributor if in doubt about whether the product is suitable for them.
- Reasonable income and capital appreciation over medium to long term
- Investment in Debt and Money Market instruments
*Investors should consult their financial advisers if in doubt about whether the product is suitable for them.