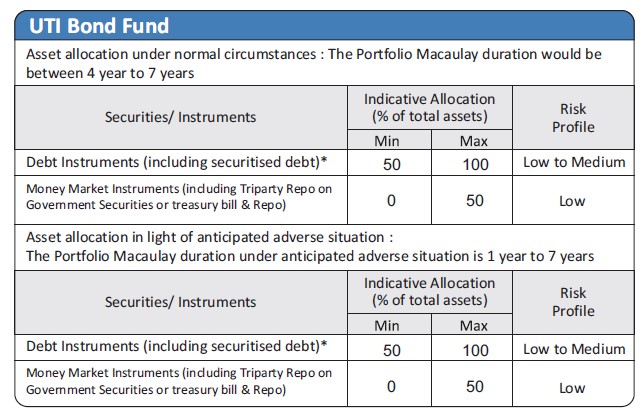
| Investment Objective The investment objective of the scheme is to generate optimal returns with adequate liquidity by investing in debt and money market instruments such that the Macaulay duration of the portfolio is between 4 years and 7 years. However there can be no assurance that the investment objective of the Scheme will be achieved. The Scheme does not guarantee / indicate any returns. |
|
Inception Date |
4th May, 1998 |
Fund Manager |
Mr. Sunil Patil, M.com, MFM Managing the scheme since Apr 2023 |
Fund AUM |
Fund size monthly average : 302.56 Crore Closing AUM : 303.65 Crore |
High/Low NAV in the month |
High Growth Option : 65.3748 Low Growth Option : 64.7218 |
Total expense ratio (%) |
Regular : 1.62 Direct : 1.25 |
Minimum Investment Amount |
Minimum initial investment under Growth option is Rs.500/- and in multiples of Re.1/-.& under IDCW option is Rs.20,000/- and in multiples of Re.1/- |
Plans/Options
(Regular / Direct) |
Growth Option Quarterly IDCW Option /Half Yearly IDCW Option/ Annual IDCW Option/Flexi IDCW Option with Payout and Reinvestment facilities. |
| Portfolio Parameters | Weighted Average Maturity : 10.25 Yrs Yield to Maturity* : 7.52% Modified Duration : 6.70 yrs Macaulay Duration :6.98 yrs *Annualized Portfolio YTM – Yields of all securities are annualized |
Load Structure |
Entry Load: Nil Exit Load: Nil |
NAV per unit as on 31st January, 2024 |
Regular Growth Option 65.3748 Regular IDCW Option 16.7906 Direct Growth Option 70.8199 Direct IDCW Option 22.3497 |
| Options Available | SIP & SWP |
Benchmark Index |
CRISIL Medium to Long Duration Debt A-III Index |
| SIP/SWP/STRIP | |
| Fund Size | 302.56 Crore (Monthly Average as on 31/1/2024) |
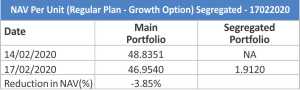
Segregated AUM & NAV |
Segregated Fund Size Monthly Average - 17022020 : 0.0 Crore Closing AUM: 0.0 Crore Segregated NAV per unit as on - 17022020 31st January, 2024 Growth : 0.0 |
UTI Bond Fund - IDCW Declared - Last 10 Quarterly IDCW |
||||||
Year |
IDCW |
Per unt |
NAV (Cum Div ) |
Face Value (per unit) |
NAV Date |
Record Date |
2017 |
2.50% |
0.250 |
14.3401 |
10.00 |
15-03-2017 |
22-03-2017 |
2017 |
1.50% |
0.150 |
14.7614 |
10.00 |
21-06-2017 |
28-06-2017 |
2017 |
1.50% |
0.150 |
14.7304 |
10.00 |
18-09-2017 |
25-09-2017 |
2017 |
1.00% |
0.100 |
14.4792 |
10.00 |
19-12-2017 |
26-12-2017 |
2018 |
3.00% |
0.300 |
11.2078 |
10.00 |
19-03-2018 |
26-03-2018 |
2018 |
0.30% |
0.030 |
14.3788 |
10.00 |
19-06-2018 |
26-06-2018 |
2018 |
0.25% |
0.025 |
14.4843 |
10.00 |
18-09-2018 |
25-09-2018 |
2018 |
1.00% |
0.100 |
14.8155 |
10.00 |
19-12-2018 |
26-12-2018 |
2019 |
0.25% |
0.025 |
14.4932 |
10.00 |
18-03-2019 |
25-03-2019 |
2020 |
1.00% |
0.100 |
13.5121 |
10.00 |
17-06-2020 |
24-06-2020 |
2020 |
1.00% |
0.100 |
16.9457 |
10.00 |
16-09-2020 |
23-09-2020 |
2020 |
1.00% |
0.100 |
13.6925 |
10.00 |
14-12-2020 |
21-12-2020 |
2021 |
0.75% |
0.075 |
13.4995 |
10.00 |
16-06-2021 |
23-06-2021 |
2021 |
0.75% |
0.075 |
13.5782 |
10.00 |
15-09-2021 |
22-09-2021 |
2021 |
0.75% |
0.075 |
14.5804 |
10.00 |
15-12-2021 |
23-12-2021 |
2022 |
1.75% |
0.175 |
14.3915 |
10.00 |
15-03-2022 |
22-03-2022 |
2022 |
0.50% |
0.050 |
15.1073 |
10.00 |
15-06-2s022 |
22-06-2022 |
2023 |
2.50% |
0.250 |
11.9791 |
10.00 |
15-03-2023 |
21-03-2023 |
The scheme IDCW details under regular plan.
Disclaimer: Pursuant to payment of Dividend/Bonus, the Nav of the income distribution cum capital withdrawal options of the schemes would fall to the extent of payout and statutory levy (if applicable)
| UTI Bond Fund (Segregated - 17022020) SEGREGATED Portfolio as on 31st January, 2024 | ||
| Portfolio | % of NAV |
Rating |
| Vodafone Idea Ltd | 0* |
CARE-B- |
| Net Current Assets | 0* |
|
| * Percentage to NAV Less Than 0.01 | ||
Portfolio |
% of Nav |
Rating |
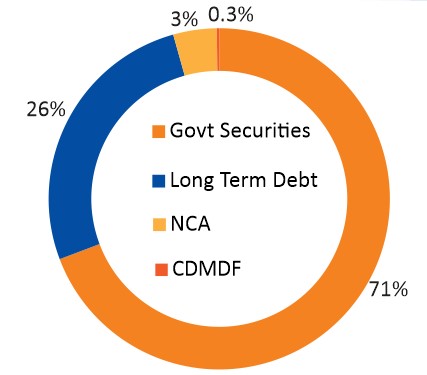
| Govt Securities | ||
| 07.18% GSEC MAT -24/07/2037 | 55.74 |
SOV |
| 07.18% GSEC MAT -14/08/2033 | 9.90 |
SOV |
| 7.74% MH SDL MAT - 01/03/2033 | 1.66 |
SOV |
| 07.78% RAJASTHAN SDL 29/03/2033 | 1.66 |
SOV |
| 7.26% GSEC 22/08/2032 | 1.66 |
SOV |
| Long Term Debt | ||
| Power Finance Corporation Ltd. | 8.26 |
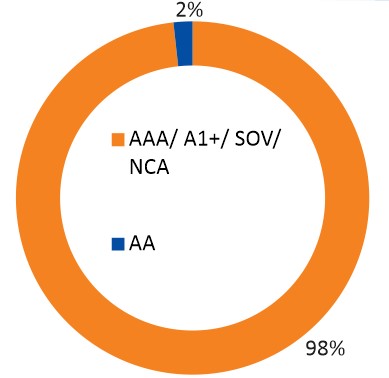
CRISIL AAA/A1+ |
| LIC Housing Finance Ltd. | 8.23 |
CRISIL AAA/A1+ |
| Jamnagar Utilities And Power Private Ltd.^ | 6.57 |
CRISIL AAA/A1+ |
| REC Ltd | 1.65 |
CRISIL AAA/A1+ |
| Piramal Capital And Housing Finance Ltd. | 1.58 |
ICRA AA |
| Corporate Debt Market Development Fund | ||
| Corporate Debt Market Devt Fund - A2 Units | 0.25 |
|
| Net Current assets | 2.82 |
|
Total |
100.00 |
| Fund Performance Vs Benchmark (CAGR) as on 31st January, 2024 Growth of 10000
|
||||||
| Period | NAV Growth (%) |
CRISIL Medium to Long Duration Debt A-III Index (%) |
CRISIL 10 Year Gilt Index (%) |
NAV Growth () |
CRISIL Medium to Long Duration Debt A-III Index () |
CRISIL 10 Year Gilt Index () |
| 1 Y | 6.81 |
7.70 |
8.25 |
10,681 |
10,770 |
10,825 |
| 3 Y | 8.90 |
4.61 |
3.39 |
12,915 |
11,448 |
11,052 |
| 5 Y | 4.65 |
7.52 |
5.98 |
12,553 |
14,372 |
13,372 |
| SI* | 7.56 |
9.35 |
NA |
65,369 |
100,008 |
NA |
Different plans have a different expense structure. The performance details provided herein are of regular plan.
*Compounded annualized Growth Rate.
For performance details of other Schemes managed by the Fund Manager, please refer the respective Scheme sheets as listed Please click here in ‘Fund Manager Summary’. N.A - Not
Available. Schemes Managed by Mr. Sunil Patil.
*The Scheme returns are inclusive of the impact of segregation of the portfolio Debt instruments of Vodafone Idea Ltd. have been segregated from the Main Portfolio on Feb 17,
2020. Load is not taken into consideration for computation of performance.
| Period | |||||||
|
Investment Amount ()
|
Value- Fund
() |
CRISIL Medium to Long Duration Debt A-III Index
() |
CRISIL 10 Year
Gilt Index () |
Yield (%) Fund
|
CRISIL Medium to Long Duration Debt A-III Index
() |
Yield (%)
CRISIL 10 Year Gilt Index |
|
1 Y |
120,000 |
124,072 |
124,700 |
124,901 |
6.33 |
7.32 |
7.63 |
3 Y |
360,000 |
409,008 |
392,517 |
390,039 |
8.46 |
5.69 |
5.27 |
5 Y |
600,000 |
722,556 |
698,789 |
678,251 |
7.37 |
6.03 |
4.85 |
7 Y |
840,000 |
1,027,470 |
1,064,585 |
1,015,731 |
5.67 |
6.66 |
5.34 |
10 Y |
1,200,000 |
1,590,340 |
1,742,377 |
1,624,571 |
5.49 |
7.24 |
5.90 |
15 Y |
1,800,000 |
2,917,756 |
3,309,702 |
2,925,159 |
6.14 |
7.68 |
6.18 |
SI |
2,300,000 |
4,436,437 |
5,167,789 |
4,357,840 |
6.41 |
7.81 |
6.25 |
Note: Systematic Investment Plan (SIP) returns are worked out assuming investment of 10,000/- every month at NAV per unit of the scheme as on the first working day for the respective time periods. The loads have not been taken into account. Past performance may or may not be sustained in future.
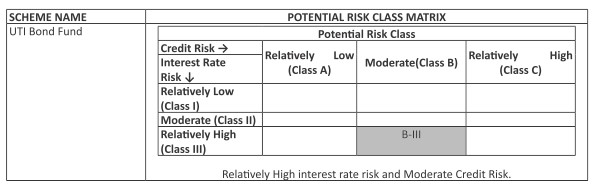
*Investors should consult their Mutual Fund Distributor if in doubt about whether the product is suitable for them.:
- Optimal returns with adequate liquidity over medium to long term
- Investment in Debt & money market instruments
*Investors should consult their financial advisers if in doubt about whether the product is suitable for them.