| Investment Objective The investment objective of the scheme is to provide returns that, before expenses, closely correspond to the total returns of the securities as represented by the underlying index, subject to tracking error. However there is no guarantee or assurance that the investment objective of the scheme will be achieved. |
|||||||||
| Inception Date |
1st September, 2015 | ||||||||
| Fund Manager |
Mr. Sharwan Kumar Goyal, CFA, MMS Managing the scheme since July-2018 & Mr Ayush Jain, Assistant Fund Manager CA, B.Com (Tax) Managing the scheme since May-2022 |
||||||||
| Fund AUM |
Average AUM for the quarter :33604.94 Crore ended 31st Dec 2023 Fund Size Monthly Average :36234.50 Crore Closing AUM : 36196.18 Crore |
||||||||
High/Low NAV in the month |
High Growth Option : 788.2560 Low Growth Option : 756.6668 |
||||||||
Total expense ratio (%) |
0.05% | ||||||||
| Market Capitalisation (%) |
|
||||||||
NAV per unit as on 31st January, 2024 |
771.5214 | ||||||||
 |
|||||||||
Benchmark Index |
S&P BSE Sensex | ||||||||
| Financial Services | 37% |
| Information Technology | 16% |
| Oil, Gas & Consumable Fuels | 12% |
| Fast Moving Consumer Goods | 9% |
| Automobile and Auto Components | 6% |
|
Equity
|
% of NAV
|
| HDFC Bank Ltd. | 13.54 |
| Reliance Industries Ltd. | 12.02 |
| ICICI Bank Ltd | 8.79 |
| Infosys Ltd. | 7.24 |
| Larsen And Toubro Ltd. | 5.13 |
| ITC Ltd. | 4.77 |
| Tata Consultancy Services Ltd. | 4.77 |
| Axis Bank Ltd. | 3.69 |
| Bharti Airtel Ltd. | 3.61 |
| Kotak Mahindra Bank Ltd. | 3.19 |
| State Bank Of India | 3.00 |
| Hindustan Unilever Ltd. | 2.70 |
| Bajaj Finance Ltd. | 2.33 |
| HCL Technologies Ltd. | 2.04 |
| Tata Motors Ltd. | 1.94 |
| Mahindra & Mahindra Ltd. | 1.93 |
| Titan Company Ltd. | 1.88 |
| Sun Pharmaceuticals Industries Ltd. | 1.87 |
| NTPC Ltd. | 1.84 |
| Maruti Suzuki India Ltd. | 1.65 |
| Asian Paints Ltd. | 1.63 |
| Power Grid Corporation Of India Ltd | 1.44 |
| Ultratech Cement Ltd. | 1.43 |
| Tata Steel Ltd. | 1.34 |
| IndusInd Bank Ltd. | 1.22 |
| Nestle India Ltd. | 1.09 |
| Bajaj Finserv Ltd. | 1.08 |
| Tech Mahindra Ltd | 1.02 |
| JSW Steel Ltd. | 0.95 |
| Wipro Ltd. | 0.82 |
| Net Current Assets | 0.04 |
TOTAL |
100.00 |
% of top 10 stocks |
66.76 |
Median Market Cap ( Cr) |
688,261 |
Weighted Average Market Cap |
773,947 |
Number of Securities |
30 |
All figures given are provisional and unaudited. |
| Fund Performance Vs Benchmark (CAGR) as on 31st January, 2024 Growth of 10000
|
||||||
| Period | NAV Growth (%) |
S&P BSE Sensex TRI (%) |
Nifty 50 TRI (%) |
NAV Growth () |
S&P BSE Sensex TRI () |
Nifty 50 TRI () |
| 1 Y | 22.05 |
22.10 |
24.35 |
12,205 |
12,210 |
12,435 |
| 3 Y | 17.06 |
17.15 |
18.19 |
16,041 |
16,078 |
16,510 |
| 5 Y | 15.92 |
16.00 |
16.29 |
20,939 |
21,012 |
21,276 |
| SI* | 14.26 |
14.34 |
14.32 |
30,731 |
30,913 |
30,867 |
The above value is calculated on the basis of the return from Growth Option of the Scheme.
Different plans have a different expense structure. The performance details provided herein are of regular plan.
The current fund manager is managing the scheme since Sep-2015
*Compounded annualized Growth Rate.
Schemes Managed by Mr. Sharwan Kumar Goyal & Mr Ayush Jain. The performance of the benchmark is calculated using total return index variant of the benchmark index.
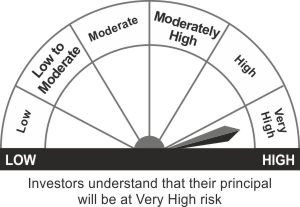
This product is suitable for investors who are seeking*
- Long term investment
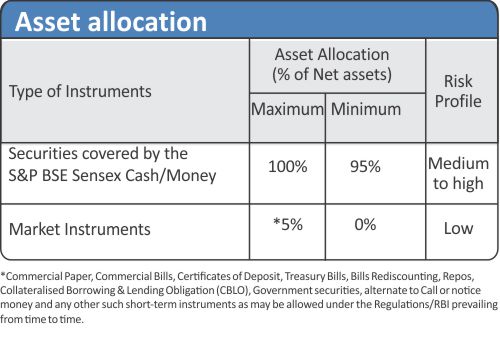
- Investment in securities covered by S&P BSE Sensex
*Investors should consult their Mutual Fund Distributor if in doubt about whether the product is suitable for them.